Data
51,681 items of data are available, covering 48,111 participants.
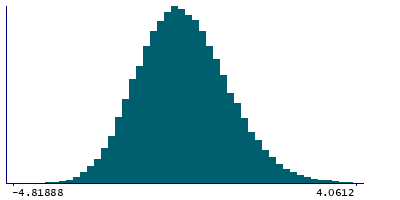
Defined-instances run from 2 to 3, labelled using Instancing
2.
Units of measurement are Std.Devs.
| Maximum | 9.26583 |
| Decile 9 | 1.10105 |
| Decile 8 | 0.543283 |
| Decile 7 | 0.150765 |
| Decile 6 | -0.171091 |
| Median | -0.471649 |
| Decile 4 | -0.75935 |
| Decile 3 | -1.06291 |
| Decile 2 | -1.40283 |
| Decile 1 | -1.85858 |
| Minimum | -7.28185 |
|
|
- Mean = -0.412648
- Std.dev = 1.16509
- 1 item below graph minimum of -4.8182
- 35 items above graph maximum of 4.06068
|
2 Instances
Instance 2 : Imaging visit (2014+)
47,674 participants, 47,674 items
| Maximum | 9.26583 |
| Decile 9 | 1.10962 |
| Decile 8 | 0.550761 |
| Decile 7 | 0.156327 |
| Decile 6 | -0.1655 |
| Median | -0.467031 |
| Decile 4 | -0.755314 |
| Decile 3 | -1.0583 |
| Decile 2 | -1.40046 |
| Decile 1 | -1.85628 |
| Minimum | -7.28185 |
|

|
- Mean = -0.40715
- Std.dev = 1.16765
- 1 item below graph minimum of -4.82217
- 31 items above graph maximum of 4.07551
|
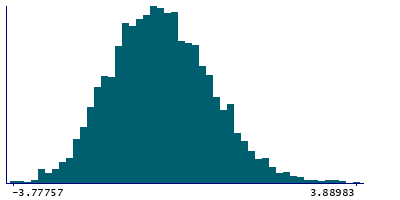
Instance 3 : First repeat imaging visit (2019+)
4,007 participants, 4,007 items
| Maximum | 4.85508 |
| Decile 9 | 0.999702 |
| Decile 8 | 0.459823 |
| Decile 7 | 0.0905337 |
| Decile 6 | -0.236464 |
| Median | -0.529278 |
| Decile 4 | -0.80272 |
| Decile 3 | -1.11397 |
| Decile 2 | -1.42992 |
| Decile 1 | -1.88941 |
| Minimum | -3.77757 |
|
|
- Mean = -0.47806
- Std.dev = 1.13212
- 2 items above graph maximum of 3.88882
|