Data
49,999 items of data are available, covering 46,554 participants.
Defined-instances run from 2 to 3, labelled using Instancing
2.
Units of measurement are Std.Devs.
| Maximum | 6.9067 |
| Decile 9 | 1.11346 |
| Decile 8 | 0.554798 |
| Decile 7 | 0.16408 |
| Decile 6 | -0.161464 |
| Median | -0.454877 |
| Decile 4 | -0.73995 |
| Decile 3 | -1.04145 |
| Decile 2 | -1.37991 |
| Decile 1 | -1.8406 |
| Minimum | -7.37413 |
|

|
- Mean = -0.397647
- Std.dev = 1.15776
- 4 items below graph minimum of -4.79466
- 35 items above graph maximum of 4.06752
|
2 Instances
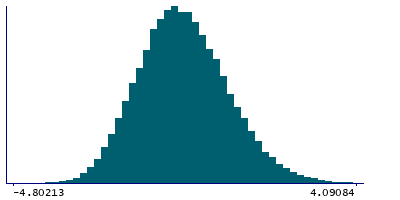
Instance 2 : Imaging visit (2014+)
46,098 participants, 46,098 items
| Maximum | 6.9067 |
| Decile 9 | 1.12651 |
| Decile 8 | 0.560352 |
| Decile 7 | 0.169646 |
| Decile 6 | -0.15703 |
| Median | -0.450712 |
| Decile 4 | -0.737631 |
| Decile 3 | -1.03883 |
| Decile 2 | -1.37682 |
| Decile 1 | -1.83746 |
| Minimum | -7.37413 |
|
|
- Mean = -0.392903
- Std.dev = 1.16096
- 4 items below graph minimum of -4.80143
- 35 items above graph maximum of 4.09049
|
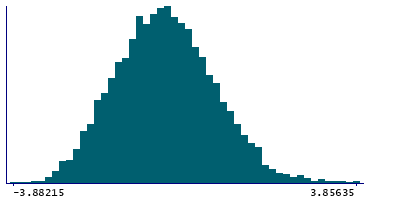
Instance 3 : First repeat imaging visit (2019+)
3,901 participants, 3,901 items
| Maximum | 3.85635 |
| Decile 9 | 0.995246 |
| Decile 8 | 0.464083 |
| Decile 7 | 0.103799 |
| Decile 6 | -0.201153 |
| Median | -0.487011 |
| Decile 4 | -0.777371 |
| Decile 3 | -1.06595 |
| Decile 2 | -1.4163 |
| Decile 1 | -1.88137 |
| Minimum | -3.88215 |
|
|
- Mean = -0.453705
- Std.dev = 1.11771
|