Data
572,201 items of data are available, covering 492,272 participants.
Defined-instances run from 0 to 3, labelled using Instancing
2.
Units of measurement are Kg.
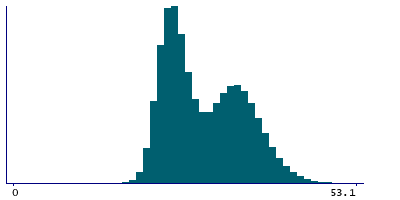
| Maximum | 58.8 |
| Decile 9 | 37.9 |
| Decile 8 | 35.4 |
| Decile 7 | 33.4 |
| Decile 6 | 31.1 |
| Median | 28.2 |
| Decile 4 | 26.3 |
| Decile 3 | 25.1 |
| Decile 2 | 24 |
| Decile 1 | 22.7 |
| Minimum | 2 |
|
|
- Mean = 29.5675
- Std.dev = 5.97016
- 21 items above graph maximum of 53.1
|
4 Instances
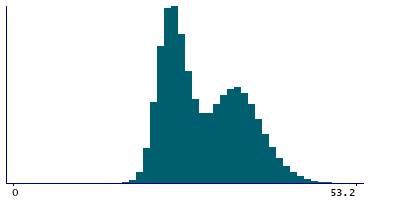
Instance 0 : Initial assessment visit (2006-2010) at which participants were recruited and consent given
491,407 participants, 491,407 items
| Maximum | 58.8 |
| Decile 9 | 38 |
| Decile 8 | 35.5 |
| Decile 7 | 33.4 |
| Decile 6 | 31 |
| Median | 28.2 |
| Decile 4 | 26.3 |
| Decile 3 | 25.1 |
| Decile 2 | 24 |
| Decile 1 | 22.8 |
| Minimum | 2 |
|
|
- Mean = 29.5868
- Std.dev = 5.98146
- 18 items above graph maximum of 53.2
|
Instance 1 : First repeat assessment visit (2012-13)
20,022 participants, 20,022 items
| Maximum | 52.7 |
| Decile 9 | 37.4 |
| Decile 8 | 35.1 |
| Decile 7 | 33.3 |
| Decile 6 | 31.4 |
| Median | 28.5 |
| Decile 4 | 26.2 |
| Decile 3 | 24.9 |
| Decile 2 | 23.7 |
| Decile 1 | 22.5 |
| Minimum | 14.3 |
|

|
- Mean = 29.4209
- Std.dev = 5.885
- 1 item above graph maximum of 52.3
|
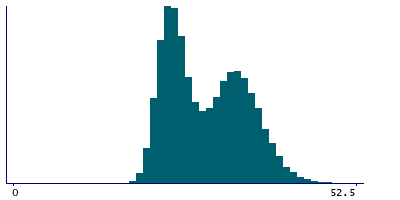
Instance 2 : Imaging visit (2014+)
55,607 participants, 55,607 items
| Maximum | 53 |
| Decile 9 | 37.5 |
| Decile 8 | 35.2 |
| Decile 7 | 33.4 |
| Decile 6 | 31.3 |
| Median | 28.6 |
| Decile 4 | 26.3 |
| Decile 3 | 24.9 |
| Decile 2 | 23.7 |
| Decile 1 | 22.5 |
| Minimum | 11.3 |
|
|
- Mean = 29.4681
- Std.dev = 5.90414
- 1 item above graph maximum of 52.5
|
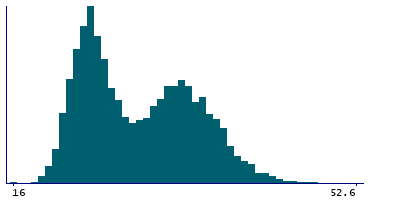
Instance 3 : First repeat imaging visit (2019+)
5,165 participants, 5,165 items
| Maximum | 53.4 |
| Decile 9 | 37.5 |
| Decile 8 | 35.1 |
| Decile 7 | 33.3 |
| Decile 6 | 31.2 |
| Median | 28.4 |
| Decile 4 | 26.1 |
| Decile 3 | 24.7 |
| Decile 2 | 23.7 |
| Decile 1 | 22.4 |
| Minimum | 16 |
|
|
- Mean = 29.3663
- Std.dev = 5.90527
- 1 item above graph maximum of 52.6
|
Notes
Body composition estimation by impedance measurement. Trunk fat free mass.
Trunk fat free mass in Kg, 0.1 increments.


