Data
572,285 items of data are available, covering 492,341 participants.
Defined-instances run from 0 to 3, labelled using Instancing
2.
Units of measurement are Kg.
| Maximum | 59.9 |
| Decile 9 | 20.4 |
| Decile 8 | 17.6 |
| Decile 7 | 15.8 |
| Decile 6 | 14.4 |
| Median | 13.2 |
| Decile 4 | 12 |
| Decile 3 | 10.8 |
| Decile 2 | 9.5 |
| Decile 1 | 7.7 |
| Minimum | 0.5 |
|

|
- Mean = 13.7148
- Std.dev = 5.14564
- 1479 items above graph maximum of 33.1
|
4 Instances
Instance 0 : Initial assessment visit (2006-2010) at which participants were recruited and consent given
491,491 participants, 491,491 items
| Maximum | 59.9 |
| Decile 9 | 20.5 |
| Decile 8 | 17.7 |
| Decile 7 | 15.9 |
| Decile 6 | 14.5 |
| Median | 13.2 |
| Decile 4 | 12 |
| Decile 3 | 10.8 |
| Decile 2 | 9.5 |
| Decile 1 | 7.7 |
| Minimum | 0.5 |
|

|
- Mean = 13.7365
- Std.dev = 5.17137
- 1204 items above graph maximum of 33.3
|
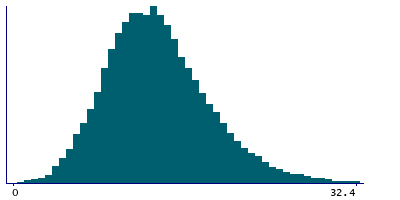
Instance 1 : First repeat assessment visit (2012-13)
20,022 participants, 20,022 items
| Maximum | 43.8 |
| Decile 9 | 20.1 |
| Decile 8 | 17.5 |
| Decile 7 | 15.7 |
| Decile 6 | 14.4 |
| Median | 13.2 |
| Decile 4 | 12 |
| Decile 3 | 10.8 |
| Decile 2 | 9.5 |
| Decile 1 | 7.8 |
| Minimum | 0.7 |
|
|
- Mean = 13.67
- Std.dev = 5.02045
- 62 items above graph maximum of 32.4
|
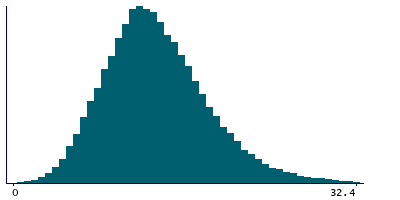
Instance 2 : Imaging visit (2014+)
55,607 participants, 55,607 items
| Maximum | 46.6 |
| Decile 9 | 20 |
| Decile 8 | 17.35 |
| Decile 7 | 15.6 |
| Decile 6 | 14.3 |
| Median | 13.1 |
| Decile 4 | 11.9 |
| Decile 3 | 10.8 |
| Decile 2 | 9.4 |
| Decile 1 | 7.6 |
| Minimum | 0.6 |
|
|
- Mean = 13.5575
- Std.dev = 4.98126
- 133 items above graph maximum of 32.4
|
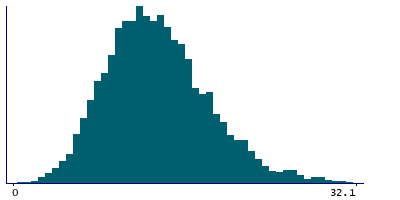
Instance 3 : First repeat imaging visit (2019+)
5,165 participants, 5,165 items
| Maximum | 37.1 |
| Decile 9 | 19.9 |
| Decile 8 | 17.4 |
| Decile 7 | 15.6 |
| Decile 6 | 14.3 |
| Median | 13.1 |
| Decile 4 | 11.9 |
| Decile 3 | 10.7 |
| Decile 2 | 9.4 |
| Decile 1 | 7.7 |
| Minimum | 0.9 |
|
|
- Mean = 13.5168
- Std.dev = 4.86991
- 10 items above graph maximum of 32.1
|
Notes
Body composition estimation by impedance measurement. Trunk fat mass
Trunk fat mass in Kg, 0.1 increments.


