Data
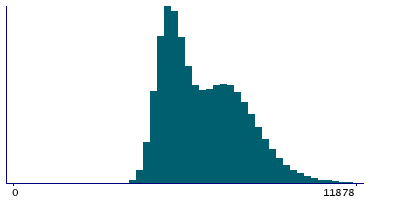
572,595 items of data are available, covering 492,595 participants.
Defined-instances run from 0 to 3, labelled using Instancing
2.
Units of measurement are KJ.
| Maximum | 15506 |
| Decile 9 | 8468 |
| Decile 8 | 7824 |
| Decile 7 | 7335 |
| Decile 6 | 6849 |
| Median | 6343 |
| Decile 4 | 5916 |
| Decile 3 | 5607 |
| Decile 2 | 5343 |
| Decile 1 | 5058 |
| Minimum | 3364 |
|
|
- Mean = 6597.51
- Std.dev = 1357.91
- 491 items above graph maximum of 11878
|
4 Instances
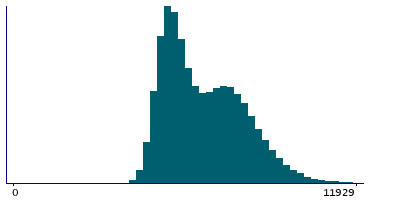
Instance 0 : Initial assessment visit (2006-2010) at which participants were recruited and consent given
491,801 participants, 491,801 items
| Maximum | 15506 |
| Decile 9 | 8502 |
| Decile 8 | 7853 |
| Decile 7 | 7355 |
| Decile 6 | 6866 |
| Median | 6351 |
| Decile 4 | 5929 |
| Decile 3 | 5619 |
| Decile 2 | 5360 |
| Decile 1 | 5075 |
| Minimum | 3364 |
|
|
- Mean = 6616.32
- Std.dev = 1364.36
- 401 items above graph maximum of 11929
|
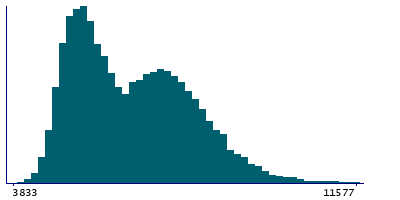
Instance 1 : First repeat assessment visit (2012-13)
20,022 participants, 20,022 items
| Maximum | 14192 |
| Decile 9 | 8289 |
| Decile 8 | 7690 |
| Decile 7 | 7243 |
| Decile 6 | 6820 |
| Median | 6339 |
| Decile 4 | 5883 |
| Decile 3 | 5548 |
| Decile 2 | 5276 |
| Decile 1 | 4996 |
| Minimum | 3833 |
|
|
- Mean = 6518.19
- Std.dev = 1312.33
- 24 items above graph maximum of 11582
|
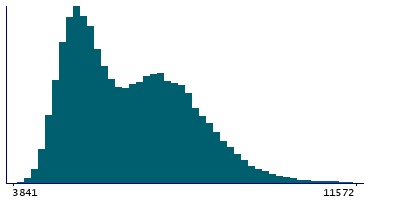
Instance 2 : Imaging visit (2014+)
55,607 participants, 55,607 items
| Maximum | 13431 |
| Decile 9 | 8263 |
| Decile 8 | 7653 |
| Decile 7 | 7192 |
| Decile 6 | 6761 |
| Median | 6289 |
| Decile 4 | 5841 |
| Decile 3 | 5510 |
| Decile 2 | 5234 |
| Decile 1 | 4954 |
| Minimum | 3841 |
|
|
- Mean = 6474.12
- Std.dev = 1312.93
- 50 items above graph maximum of 11572
|
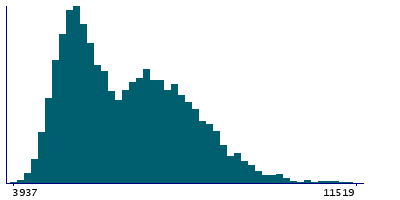
Instance 3 : First repeat imaging visit (2019+)
5,165 participants, 5,165 items
| Maximum | 13180 |
| Decile 9 | 8230 |
| Decile 8 | 7619 |
| Decile 7 | 7159 |
| Decile 6 | 6736 |
| Median | 6261 |
| Decile 4 | 5807 |
| Decile 3 | 5485 |
| Decile 2 | 5222 |
| Decile 1 | 4941 |
| Minimum | 3937 |
|
|
- Mean = 6442.83
- Std.dev = 1299.93
- 6 items above graph maximum of 11519
|
Notes
Body composition estimation by impedance measurement. Basal metabolic rate
Return value in Kilo- Joules.


