Data
572,606 items of data are available, covering 492,605 participants.
Defined-instances run from 0 to 3, labelled using Instancing
2.
Units of measurement are Kg/m2.
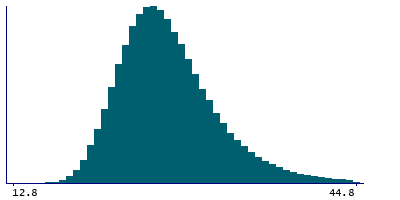
| Maximum | 68.4 |
| Decile 9 | 33.4 |
| Decile 8 | 30.7 |
| Decile 7 | 29 |
| Decile 6 | 27.8 |
| Median | 26.7 |
| Decile 4 | 25.6 |
| Decile 3 | 24.6 |
| Decile 2 | 23.5 |
| Decile 1 | 22 |
| Minimum | 12.8 |
|
|
- Mean = 27.335
- Std.dev = 4.7549
- 2905 items above graph maximum of 44.8
|
4 Instances
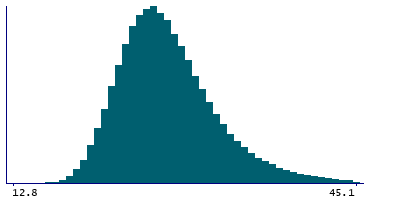
Instance 0 : Initial assessment visit (2006-2010) at which participants were recruited and consent given
491,812 participants, 491,812 items
| Maximum | 68.4 |
| Decile 9 | 33.6 |
| Decile 8 | 30.8 |
| Decile 7 | 29.1 |
| Decile 6 | 27.9 |
| Median | 26.7 |
| Decile 4 | 25.7 |
| Decile 3 | 24.7 |
| Decile 2 | 23.6 |
| Decile 1 | 22.1 |
| Minimum | 12.8 |
|
|
- Mean = 27.4327
- Std.dev = 4.78521
- 2486 items above graph maximum of 45.1
|
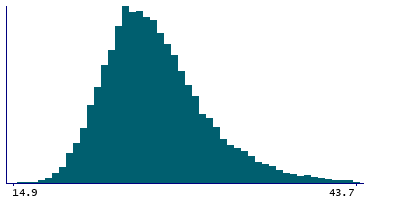
Instance 1 : First repeat assessment visit (2012-13)
20,022 participants, 20,022 items
| Maximum | 59.4 |
| Decile 9 | 32.8 |
| Decile 8 | 30.1 |
| Decile 7 | 28.5 |
| Decile 6 | 27.3 |
| Median | 26.3 |
| Decile 4 | 25.3 |
| Decile 3 | 24.3 |
| Decile 2 | 23.3 |
| Decile 1 | 21.9 |
| Minimum | 14.9 |
|
|
- Mean = 26.9608
- Std.dev = 4.57633
- 125 items above graph maximum of 43.7
|
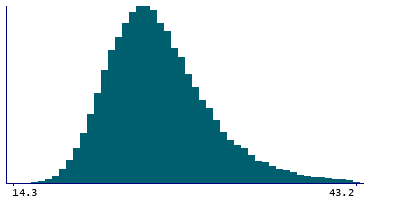
Instance 2 : Imaging visit (2014+)
55,607 participants, 55,607 items
| Maximum | 62 |
| Decile 9 | 32.4 |
| Decile 8 | 29.9 |
| Decile 7 | 28.3 |
| Decile 6 | 27.1 |
| Median | 26.1 |
| Decile 4 | 25.1 |
| Decile 3 | 24.1 |
| Decile 2 | 23 |
| Decile 1 | 21.6 |
| Minimum | 14.3 |
|
|
- Mean = 26.6903
- Std.dev = 4.50966
- 290 items above graph maximum of 43.2
|
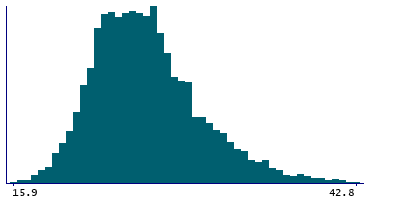
Instance 3 : First repeat imaging visit (2019+)
5,165 participants, 5,165 items
| Maximum | 56.7 |
| Decile 9 | 32.2 |
| Decile 8 | 29.6 |
| Decile 7 | 28 |
| Decile 6 | 26.9 |
| Median | 25.8 |
| Decile 4 | 24.9 |
| Decile 3 | 23.8 |
| Decile 2 | 22.8 |
| Decile 1 | 21.6 |
| Minimum | 15.9 |
|
|
- Mean = 26.4217
- Std.dev = 4.38554
- 21 items above graph maximum of 42.8
|


