Data
445,581 items of data are available, covering 351,226 participants.
Some values have special meanings defined by Data-Coding
100291.
Defined-instances run from 0 to 3, labelled using Instancing
2.
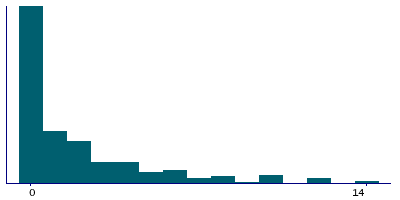
Units of measurement are pints.
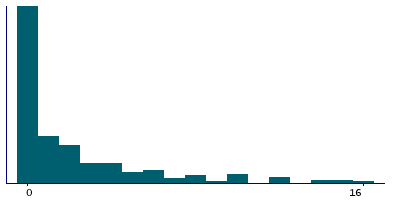
| Maximum | 210 |
| Decile 9 | 8 |
| Decile 8 | 4 |
| Decile 7 | 3 |
| Decile 6 | 2 |
| Median | 1 |
| Decile 4 | 0 |
| Decile 3 | 0 |
| Decile 2 | 0 |
| Decile 1 | 0 |
| Minimum | 0 |
|
|
- There are 73 distinct values.
- Mean = 2.84273
- Std.dev = 5.30736
- 12812 items above graph maximum of 16
- 373 items have value -3 (Prefer not to answer)
- 1238 items have value -1 (Do not know)
|
4 Instances
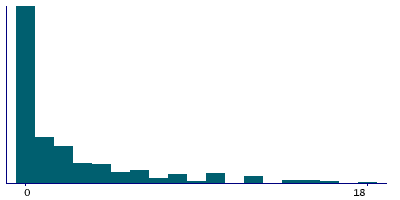
Instance 0 : Initial assessment visit (2006-2010) at which participants were recruited and consent given
346,120 participants, 346,120 items
| Maximum | 210 |
| Decile 9 | 9 |
| Decile 8 | 5 |
| Decile 7 | 3 |
| Decile 6 | 2 |
| Median | 1 |
| Decile 4 | 0 |
| Decile 3 | 0 |
| Decile 2 | 0 |
| Decile 1 | 0 |
| Minimum | 0 |
|
|
- There are 73 distinct values.
- Mean = 3.01399
- Std.dev = 5.60636
- 10183 items above graph maximum of 18
- 330 items have value -3 (Prefer not to answer)
- 1089 items have value -1 (Do not know)
|
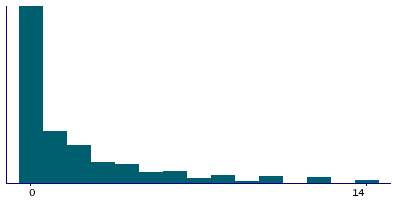
Instance 1 : First repeat assessment visit (2012-13)
14,494 participants, 14,494 items
| Maximum | 55 |
| Decile 9 | 7 |
| Decile 8 | 4 |
| Decile 7 | 2 |
| Decile 6 | 1 |
| Median | 1 |
| Decile 4 | 0 |
| Decile 3 | 0 |
| Decile 2 | 0 |
| Decile 1 | 0 |
| Minimum | 0 |
|
|
- There are 37 distinct values.
- Mean = 2.4767
- Std.dev = 4.49159
- 421 items above graph maximum of 14
- 6 items have value -3 (Prefer not to answer)
- 22 items have value -1 (Do not know)
|
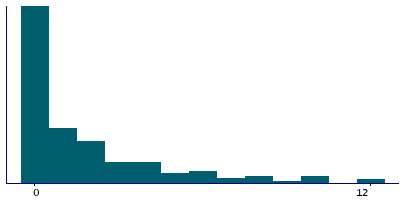
Instance 2 : Imaging visit (2014+)
70,511 participants, 70,511 items
| Maximum | 84 |
| Decile 9 | 6 |
| Decile 8 | 4 |
| Decile 7 | 2 |
| Decile 6 | 1 |
| Median | 1 |
| Decile 4 | 0 |
| Decile 3 | 0 |
| Decile 2 | 0 |
| Decile 1 | 0 |
| Minimum | 0 |
|
|
- There are 46 distinct values.
- Mean = 2.19035
- Std.dev = 3.96276
- 1904 items above graph maximum of 12
- 32 items have value -3 (Prefer not to answer)
- 110 items have value -1 (Do not know)
|
Instance 3 : First repeat imaging visit (2019+)
14,456 participants, 14,456 items
| Maximum | 64 |
| Decile 9 | 6 |
| Decile 8 | 4 |
| Decile 7 | 2 |
| Decile 6 | 1 |
| Median | 1 |
| Decile 4 | 0 |
| Decile 3 | 0 |
| Decile 2 | 0 |
| Decile 1 | 0 |
| Minimum | 0 |
|
|
- There are 34 distinct values.
- Mean = 2.30033
- Std.dev = 3.97701
- 403 items above graph maximum of 12
- 5 items have value -3 (Prefer not to answer)
- 17 items have value -1 (Do not know)
|
Notes
ACE touchscreen question "In an average WEEK, how many pints of beer or cider would you drink? (Include bitter, lager, stout, ale, Guinness)"
The following checks were performed:
- If answer < 0 then rejected
- If answer > 250 then rejected
- If answer > 100 then participant asked to confirm
Field 1588 was collected from participants who indicated they drink alcohol more often than once or twice a week, as defined by their answers to Field 1558
Coding 100291 defines 2 special values:
- -1 represents "Do not know"
- -3 represents "Prefer not to answer"
1 Related Data-Field
| Field ID | Description | Relationship |
|---|
| 1558 | Alcohol intake frequency. | Current Field was collected from participants who indicated they drink alcohol more often than once or twice a week, as defined by their answers to Field 1558 |
1 Application
| Application ID | Title |
|---|
| 31187 | Integrative Prioritization of Loci for Alcohol Use Disorders and Associated Complex Traits |


