Data
484,791 items of data are available, covering 468,356 participants.
Defined-instances run from 0 to 1, labelled using Instancing
2.
Units of measurement are umol/L.
| Maximum | 144.52 |
| Decile 9 | 13.87 |
| Decile 8 | 11.18 |
| Decile 7 | 9.8 |
| Decile 6 | 8.83 |
| Median | 8.06 |
| Decile 4 | 7.38 |
| Decile 3 | 6.74 |
| Decile 2 | 6.08 |
| Decile 1 | 5.29 |
| Minimum | 1.08 |
|

|
- Mean = 9.11872
- Std.dev = 4.42384
- 9649 items above graph maximum of 22.45
|
2 Instances
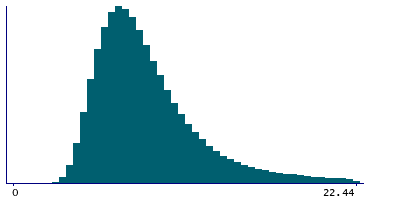
Instance 0 : Initial assessment visit (2006-2010) at which participants were recruited and consent given
467,035 participants, 467,035 items
| Maximum | 144.52 |
| Decile 9 | 13.87 |
| Decile 8 | 11.19 |
| Decile 7 | 9.81 |
| Decile 6 | 8.84 |
| Median | 8.07 |
| Decile 4 | 7.39 |
| Decile 3 | 6.75 |
| Decile 2 | 6.08 |
| Decile 1 | 5.3 |
| Minimum | 1.08 |
|
|
- Mean = 9.12471
- Std.dev = 4.42554
- 9311 items above graph maximum of 22.44
|
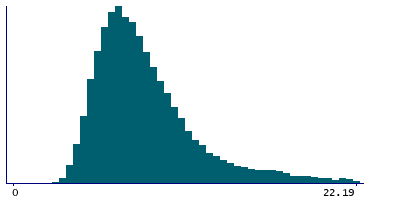
Instance 1 : First repeat assessment visit (2012-13)
17,756 participants, 17,756 items
| Maximum | 55.08 |
| Decile 9 | 13.69 |
| Decile 8 | 10.89 |
| Decile 7 | 9.57 |
| Decile 6 | 8.65 |
| Median | 7.88 |
| Decile 4 | 7.22 |
| Decile 3 | 6.61 |
| Decile 2 | 5.98 |
| Decile 1 | 5.22 |
| Minimum | 1.84 |
|
|
- Mean = 8.96133
- Std.dev = 4.37576
- 376 items above graph maximum of 22.16
|
Notes
Measured by photometric colour analysis on a Beckman Coulter AU5800
0 Related Data-Fields
There are no related data-fields
6 Applications
| Application ID | Title |
|---|
| 13721 | Causal associations of circulating biomarkers with cardiovascular disease |
| 50016 | Dummy application for biomarker data |
| 48818 | Evaluate the causal effects of diet-modifiable biomarkers on clinical outcomes using Mendelian randomization |
| 45925 | Risk Factors, Biomarkers and Impact of Major Vision-Threatening Eye Diseases |
| 46466 | Serum cardiometabolic and liver function markers in relation to colorectal cancer risk and survival |
| 5167 | The role of serum-based small molecule antioxidants in preventing and predicting age-related phenotypes and respiratory cancer |

