Data
1,414,645 items of data are available, covering 457,010 participants.
Defined-instances run from 0 to 3, labelled using Instancing
2.
Array indices run from 0 to 2.
Units of measurement are litres/min.
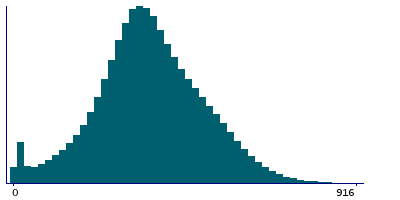
| Maximum | 2850 |
| Decile 9 | 550 |
| Decile 8 | 482 |
| Decile 7 | 432 |
| Decile 6 | 391 |
| Median | 358 |
| Decile 4 | 327 |
| Decile 3 | 294 |
| Decile 2 | 252 |
| Decile 1 | 184 |
| Minimum | 6 |
|
|
- There are 1152 distinct values.
- Mean = 362.513
- Std.dev = 144.302
- 483 items above graph maximum of 916
|
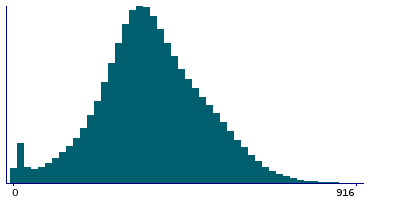
4 Instances
Instance 0 : Initial assessment visit (2006-2010) at which participants were recruited and consent given
453,186 participants, 1,239,673 items
| Maximum | 2850 |
| Decile 9 | 553 |
| Decile 8 | 484 |
| Decile 7 | 434 |
| Decile 6 | 394 |
| Median | 360 |
| Decile 4 | 330 |
| Decile 3 | 297 |
| Decile 2 | 256 |
| Decile 1 | 190 |
| Minimum | 6 |
|
|
- There are 1148 distinct values.
- Mean = 365.833
- Std.dev = 143.884
- 462 items above graph maximum of 916
|
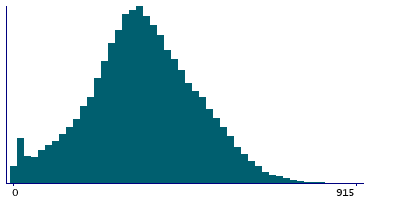
Instance 1 : First repeat assessment visit (2012-13)
18,084 participants, 49,529 items
| Maximum | 1017 |
| Decile 9 | 533 |
| Decile 8 | 466 |
| Decile 7 | 416 |
| Decile 6 | 376 |
| Median | 341 |
| Decile 4 | 308 |
| Decile 3 | 272 |
| Decile 2 | 226 |
| Decile 1 | 151 |
| Minimum | 6 |
|
|
- There are 809 distinct values.
- Mean = 342.886
- Std.dev = 145.352
- 5 items above graph maximum of 915
|
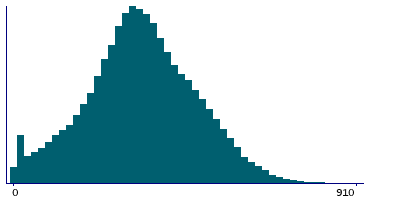
Instance 2 : Imaging visit (2014+)
43,071 participants, 117,634 items
| Maximum | 1069 |
| Decile 9 | 527 |
| Decile 8 | 461 |
| Decile 7 | 410 |
| Decile 6 | 370 |
| Median | 335 |
| Decile 4 | 302 |
| Decile 3 | 267 |
| Decile 2 | 220 |
| Decile 1 | 144 |
| Minimum | 6 |
|
|
- There are 858 distinct values.
- Mean = 337.284
- Std.dev = 145.256
- 16 items above graph maximum of 910
|
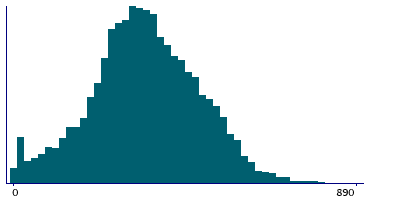
Instance 3 : First repeat imaging visit (2019+)
2,912 participants, 7,809 items
| Maximum | 948 |
| Decile 9 | 522.5 |
| Decile 8 | 460 |
| Decile 7 | 412 |
| Decile 6 | 372 |
| Median | 338 |
| Decile 4 | 305 |
| Decile 3 | 270 |
| Decile 2 | 230 |
| Decile 1 | 156.5 |
| Minimum | 6 |
|
|
- There are 696 distinct values.
- Mean = 339.922
- Std.dev = 139.805
- 1 item above graph maximum of 889
|


