Data
1,414,645 items of data are available, covering 457,010 participants.
Defined-instances run from 0 to 3, labelled using Instancing
2.
Array indices run from 0 to 2.
Units of measurement are litres.
| Maximum | 22.33 |
| Decile 9 | 3.79 |
| Decile 8 | 3.38 |
| Decile 7 | 3.09 |
| Decile 6 | 2.85 |
| Median | 2.65 |
| Decile 4 | 2.46 |
| Decile 3 | 2.27 |
| Decile 2 | 2.06 |
| Decile 1 | 1.76 |
| Minimum | 0.01 |
|
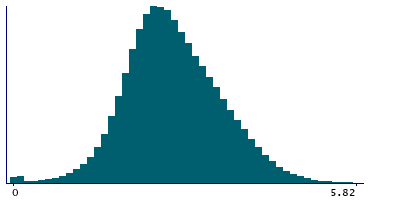
|
- Mean = 2.70897
- Std.dev = 0.824017
- 1014 items above graph maximum of 5.82
|
4 Instances
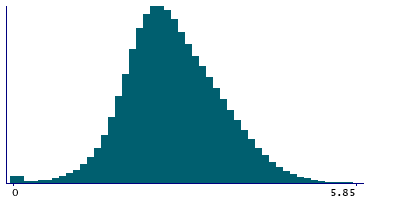
Instance 0 : Initial assessment visit (2006-2010) at which participants were recruited and consent given
453,186 participants, 1,239,673 items
| Maximum | 22.33 |
| Decile 9 | 3.81 |
| Decile 8 | 3.4 |
| Decile 7 | 3.11 |
| Decile 6 | 2.87 |
| Median | 2.66 |
| Decile 4 | 2.47 |
| Decile 3 | 2.28 |
| Decile 2 | 2.07 |
| Decile 1 | 1.77 |
| Minimum | 0.01 |
|
|
- Mean = 2.72374
- Std.dev = 0.826931
- 926 items above graph maximum of 5.85
|
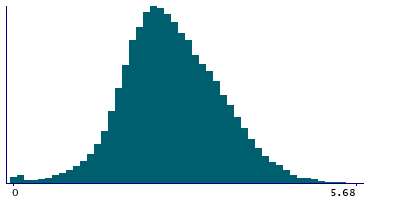
Instance 1 : First repeat assessment visit (2012-13)
18,084 participants, 49,529 items
| Maximum | 8.04 |
| Decile 9 | 3.68 |
| Decile 8 | 3.3 |
| Decile 7 | 3.02 |
| Decile 6 | 2.78 |
| Median | 2.57 |
| Decile 4 | 2.38 |
| Decile 3 | 2.19 |
| Decile 2 | 1.97 |
| Decile 1 | 1.68 |
| Minimum | 0.01 |
|
|
- Mean = 2.62189
- Std.dev = 0.808572
- 11 items above graph maximum of 5.68
|
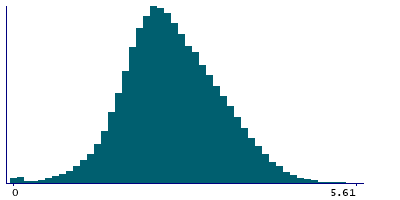
Instance 2 : Imaging visit (2014+)
43,071 participants, 117,634 items
| Maximum | 14.78 |
| Decile 9 | 3.64 |
| Decile 8 | 3.26 |
| Decile 7 | 2.98 |
| Decile 6 | 2.75 |
| Median | 2.54 |
| Decile 4 | 2.36 |
| Decile 3 | 2.17 |
| Decile 2 | 1.96 |
| Decile 1 | 1.67 |
| Minimum | 0.01 |
|
|
- Mean = 2.59772
- Std.dev = 0.791745
- 55 items above graph maximum of 5.61
|
Instance 3 : First repeat imaging visit (2019+)
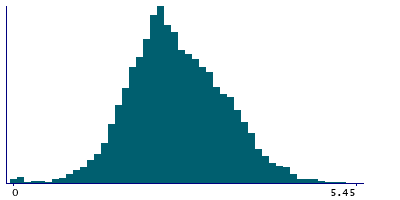
2,912 participants, 7,809 items
| Maximum | 5.45 |
| Decile 9 | 3.6 |
| Decile 8 | 3.24 |
| Decile 7 | 2.98 |
| Decile 6 | 2.75 |
| Median | 2.53 |
| Decile 4 | 2.35 |
| Decile 3 | 2.18 |
| Decile 2 | 1.96 |
| Decile 1 | 1.69 |
| Minimum | 0.02 |
|
|
- Mean = 2.5917
- Std.dev = 0.760204
|


