Data
83,905 items of data are available, covering 79,378 participants.
Defined-instances run from 2 to 3, labelled using Instancing
2.
Units of measurement are AU.
| Maximum | 0.450062 |
| Decile 9 | 0.114328 |
| Decile 8 | 0.102575 |
| Decile 7 | 0.0954767 |
| Decile 6 | 0.0901334 |
| Median | 0.0854796 |
| Decile 4 | 0.0811096 |
| Decile 3 | 0.0767462 |
| Decile 2 | 0.071822 |
| Decile 1 | 0.0653377 |
| Minimum | 0 |
|

|
- Mean = 0.0883862
- Std.dev = 0.0215021
- 635 items above graph maximum of 0.163318
|
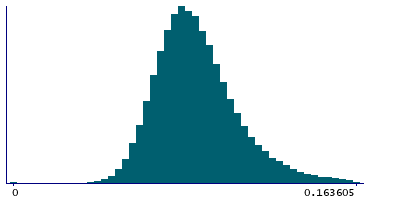
2 Instances
Instance 2 : Imaging visit (2014+)
79,147 participants, 79,147 items
| Maximum | 0.450062 |
| Decile 9 | 0.11483 |
| Decile 8 | 0.103022 |
| Decile 7 | 0.0958594 |
| Decile 6 | 0.090536 |
| Median | 0.0858933 |
| Decile 4 | 0.0814776 |
| Decile 3 | 0.0771513 |
| Decile 2 | 0.0722088 |
| Decile 1 | 0.0657059 |
| Minimum | 0 |
|
|
- Mean = 0.0888003
- Std.dev = 0.021557
- 598 items above graph maximum of 0.163954
|
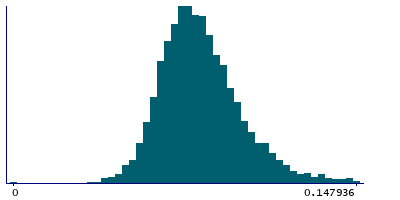
Instance 3 : First repeat imaging visit (2019+)
4,758 participants, 4,758 items
| Maximum | 0.326119 |
| Decile 9 | 0.104582 |
| Decile 8 | 0.094114 |
| Decile 7 | 0.0879158 |
| Decile 6 | 0.0830994 |
| Median | 0.078891 |
| Decile 4 | 0.0750468 |
| Decile 3 | 0.0710378 |
| Decile 2 | 0.066678 |
| Decile 1 | 0.0612147 |
| Minimum | 0 |
|
|
- Mean = 0.0814978
- Std.dev = 0.0193056
- 38 items above graph maximum of 0.147948
|
Notes
Weighted-mean ISOVF (isotropic or free water volume fraction) in tract right posterior thalamic radiation (from dMRI data)
0 Related Data-Fields
There are no related data-fields
2 Applications
| Application ID | Title |
|---|
| 17689 | Genetic, environmental and lifestyle predictors of brain/cognitive-related outcomes. |
| 22783 | The joint analysis of imaging data and genetic data for early tumor detection, prevention, diagnosis and treatment |

