Data
83,905 items of data are available, covering 79,378 participants.
Defined-instances run from 2 to 3, labelled using Instancing
2.
Units of measurement are AU.
| Maximum | 0.516678 |
| Decile 9 | 0.235344 |
| Decile 8 | 0.230078 |
| Decile 7 | 0.22645 |
| Decile 6 | 0.223438 |
| Median | 0.220701 |
| Decile 4 | 0.218009 |
| Decile 3 | 0.215186 |
| Decile 2 | 0.211892 |
| Decile 1 | 0.207513 |
| Minimum | 0 |
|

|
- Mean = 0.221163
- Std.dev = 0.0113196
- 6 items below graph minimum of 0.179681
- 94 items above graph maximum of 0.263175
|
2 Instances
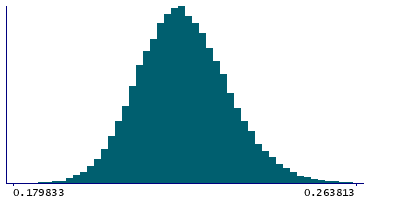
Instance 2 : Imaging visit (2014+)
79,147 participants, 79,147 items
| Maximum | 0.510416 |
| Decile 9 | 0.235388 |
| Decile 8 | 0.230081 |
| Decile 7 | 0.226452 |
| Decile 6 | 0.22342 |
| Median | 0.220682 |
| Decile 4 | 0.21799 |
| Decile 3 | 0.215167 |
| Decile 2 | 0.211866 |
| Decile 1 | 0.207485 |
| Minimum | 0 |
|
|
- Mean = 0.221154
- Std.dev = 0.01131
- 6 items below graph minimum of 0.179582
- 90 items above graph maximum of 0.263291
|
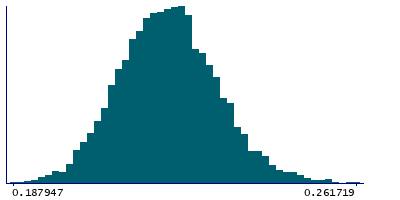
Instance 3 : First repeat imaging visit (2019+)
4,758 participants, 4,758 items
| Maximum | 0.516678 |
| Decile 9 | 0.23486 |
| Decile 8 | 0.230014 |
| Decile 7 | 0.226419 |
| Decile 6 | 0.223631 |
| Median | 0.220988 |
| Decile 4 | 0.218368 |
| Decile 3 | 0.21553 |
| Decile 2 | 0.21228 |
| Decile 1 | 0.207988 |
| Minimum | 0.187947 |
|
|
- Mean = 0.221328
- Std.dev = 0.0114773
- 5 items above graph maximum of 0.261732
|
Notes
Weighted-mean OD (orientation dispersion index) in tract left superior longitudinal fasciculus (from dMRI data)
0 Related Data-Fields
There are no related data-fields
2 Applications
| Application ID | Title |
|---|
| 17689 | Genetic, environmental and lifestyle predictors of brain/cognitive-related outcomes. |
| 22783 | The joint analysis of imaging data and genetic data for early tumor detection, prevention, diagnosis and treatment |

