Data
83,905 items of data are available, covering 79,378 participants.
Defined-instances run from 2 to 3, labelled using Instancing
2.
Units of measurement are AU.
| Maximum | 0.284843 |
| Decile 9 | 0.177446 |
| Decile 8 | 0.170761 |
| Decile 7 | 0.166067 |
| Decile 6 | 0.162114 |
| Median | 0.158434 |
| Decile 4 | 0.154922 |
| Decile 3 | 0.151243 |
| Decile 2 | 0.146898 |
| Decile 1 | 0.141093 |
| Minimum | 0 |
|

|
- Mean = 0.158963
- Std.dev = 0.014586
- 27 items below graph minimum of 0.10474
- 52 items above graph maximum of 0.213799
|
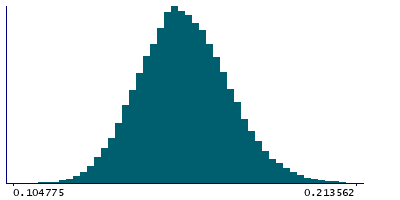
2 Instances
Instance 2 : Imaging visit (2014+)
79,147 participants, 79,147 items
| Maximum | 0.284843 |
| Decile 9 | 0.17739 |
| Decile 8 | 0.170718 |
| Decile 7 | 0.166014 |
| Decile 6 | 0.162054 |
| Median | 0.158368 |
| Decile 4 | 0.154876 |
| Decile 3 | 0.151197 |
| Decile 2 | 0.146856 |
| Decile 1 | 0.141039 |
| Minimum | 0 |
|
|
- Mean = 0.158918
- Std.dev = 0.0145855
- 24 items below graph minimum of 0.104687
- 51 items above graph maximum of 0.213741
|
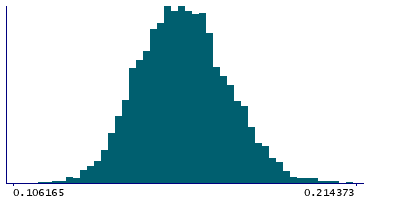
Instance 3 : First repeat imaging visit (2019+)
4,758 participants, 4,758 items
| Maximum | 0.233246 |
| Decile 9 | 0.17828 |
| Decile 8 | 0.171511 |
| Decile 7 | 0.166716 |
| Decile 6 | 0.163047 |
| Median | 0.159344 |
| Decile 4 | 0.155695 |
| Decile 3 | 0.15194 |
| Decile 2 | 0.147625 |
| Decile 1 | 0.142228 |
| Minimum | 0 |
|
|
- Mean = 0.159716
- Std.dev = 0.0145735
- 3 items below graph minimum of 0.106176
- 1 item above graph maximum of 0.214331
|
Notes
Weighted-mean OD (orientation dispersion index) in tract right corticospinal tract (from dMRI data)
0 Related Data-Fields
There are no related data-fields
2 Applications
| Application ID | Title |
|---|
| 17689 | Genetic, environmental and lifestyle predictors of brain/cognitive-related outcomes. |
| 22783 | The joint analysis of imaging data and genetic data for early tumor detection, prevention, diagnosis and treatment |

