Data
83,905 items of data are available, covering 79,378 participants.
Defined-instances run from 2 to 3, labelled using Instancing
2.
Units of measurement are AU.
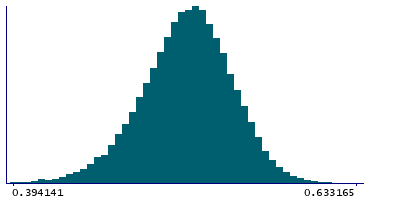
| Maximum | 0.989034 |
| Decile 9 | 0.552602 |
| Decile 8 | 0.53973 |
| Decile 7 | 0.530379 |
| Decile 6 | 0.522502 |
| Median | 0.514821 |
| Decile 4 | 0.506937 |
| Decile 3 | 0.49815 |
| Decile 2 | 0.487212 |
| Decile 1 | 0.471095 |
| Minimum | 0 |
|
|
- Mean = 0.512901
- Std.dev = 0.0341595
- 152 items below graph minimum of 0.389589
- 31 items above graph maximum of 0.634109
|
2 Instances
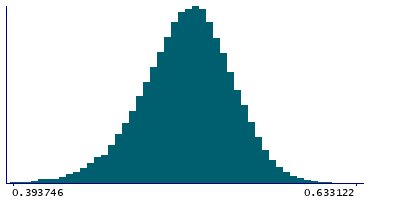
Instance 2 : Imaging visit (2014+)
79,147 participants, 79,147 items
| Maximum | 0.989034 |
| Decile 9 | 0.552411 |
| Decile 8 | 0.539552 |
| Decile 7 | 0.530174 |
| Decile 6 | 0.522288 |
| Median | 0.514557 |
| Decile 4 | 0.506634 |
| Decile 3 | 0.497796 |
| Decile 2 | 0.486819 |
| Decile 1 | 0.470689 |
| Minimum | 0 |
|
|
- Mean = 0.51261
- Std.dev = 0.0342197
- 143 items below graph minimum of 0.388967
- 30 items above graph maximum of 0.634134
|
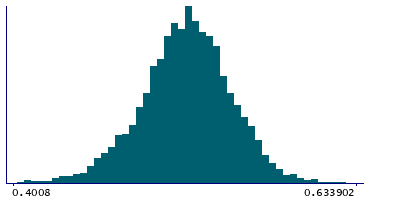
Instance 3 : First repeat imaging visit (2019+)
4,758 participants, 4,758 items
| Maximum | 0.748199 |
| Decile 9 | 0.556218 |
| Decile 8 | 0.542533 |
| Decile 7 | 0.534063 |
| Decile 6 | 0.526126 |
| Median | 0.519115 |
| Decile 4 | 0.511539 |
| Decile 3 | 0.503853 |
| Decile 2 | 0.494226 |
| Decile 1 | 0.478494 |
| Minimum | 0 |
|
|
- Mean = 0.517742
- Std.dev = 0.0327659
- 9 items below graph minimum of 0.40077
- 1 item above graph maximum of 0.633942
|
Notes
Weighted-mean ICVF (intra-cellular volume fraction) in tract left posterior thalamic radiation (from dMRI data)
0 Related Data-Fields
There are no related data-fields
2 Applications
| Application ID | Title |
|---|
| 17689 | Genetic, environmental and lifestyle predictors of brain/cognitive-related outcomes. |
| 22783 | The joint analysis of imaging data and genetic data for early tumor detection, prevention, diagnosis and treatment |

