Data
83,909 items of data are available, covering 79,382 participants.
Defined-instances run from 2 to 3, labelled using Instancing
2.
Units of measurement are AU.
| Maximum | 0.808164 |
| Decile 9 | 0.648126 |
| Decile 8 | 0.621628 |
| Decile 7 | 0.601231 |
| Decile 6 | 0.583029 |
| Median | 0.56556 |
| Decile 4 | 0.547359 |
| Decile 3 | 0.526567 |
| Decile 2 | 0.501621 |
| Decile 1 | 0.463868 |
| Minimum | 0 |
|

|
- Mean = 0.559594
- Std.dev = 0.0733587
- 120 items below graph minimum of 0.279609
|
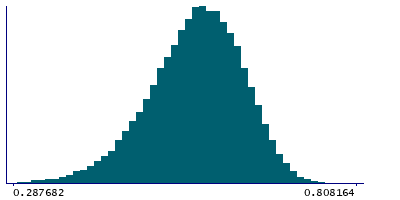
2 Instances
Instance 2 : Imaging visit (2014+)
79,151 participants, 79,151 items
| Maximum | 0.808164 |
| Decile 9 | 0.647703 |
| Decile 8 | 0.621261 |
| Decile 7 | 0.600862 |
| Decile 6 | 0.582529 |
| Median | 0.565082 |
| Decile 4 | 0.546837 |
| Decile 3 | 0.525956 |
| Decile 2 | 0.50089 |
| Decile 1 | 0.463149 |
| Minimum | 0 |
|
|
- Mean = 0.559062
- Std.dev = 0.0735151
- 110 items below graph minimum of 0.278595
|
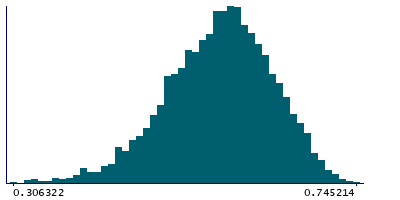
Instance 3 : First repeat imaging visit (2019+)
4,758 participants, 4,758 items
| Maximum | 0.745214 |
| Decile 9 | 0.653717 |
| Decile 8 | 0.627343 |
| Decile 7 | 0.607409 |
| Decile 6 | 0.590212 |
| Median | 0.573829 |
| Decile 4 | 0.556564 |
| Decile 3 | 0.536063 |
| Decile 2 | 0.512461 |
| Decile 1 | 0.480009 |
| Minimum | 0 |
|
|
- Mean = 0.568447
- Std.dev = 0.0701167
- 8 items below graph minimum of 0.306301
|
Notes
Weighted-mean MO (diffusion tensor mode) in tract right cingulate gyrus part of cingulum (from dMRI data)
0 Related Data-Fields
There are no related data-fields
2 Applications
| Application ID | Title |
|---|
| 17689 | Genetic, environmental and lifestyle predictors of brain/cognitive-related outcomes. |
| 22783 | The joint analysis of imaging data and genetic data for early tumor detection, prevention, diagnosis and treatment |

