Data
83,909 items of data are available, covering 79,382 participants.
Defined-instances run from 2 to 3, labelled using Instancing
2.
Units of measurement are AU.
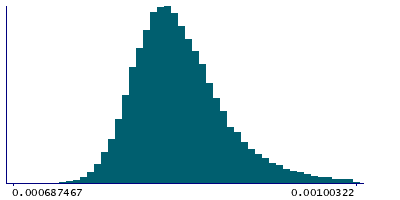
| Maximum | 0.00152035 |
| Decile 9 | 0.000901912 |
| Decile 8 | 0.000875489 |
| Decile 7 | 0.000859631 |
| Decile 6 | 0.000847628 |
| Median | 0.000837317 |
| Decile 4 | 0.000827798 |
| Decile 3 | 0.000818204 |
| Decile 2 | 0.00080779 |
| Decile 1 | 0.000794289 |
| Minimum | 0 |
|
|
- Mean = 0.000844259
- Std.dev = 4.92916e-05
- 23 items below graph minimum of 0.000686666
- 660 items above graph maximum of 0.00100954
|
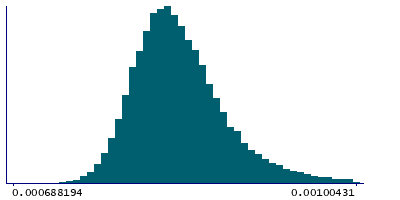
2 Instances
Instance 2 : Imaging visit (2014+)
79,151 participants, 79,151 items
| Maximum | 0.00152035 |
| Decile 9 | 0.000903037 |
| Decile 8 | 0.000876426 |
| Decile 7 | 0.000860484 |
| Decile 6 | 0.000848445 |
| Median | 0.000838143 |
| Decile 4 | 0.000828617 |
| Decile 3 | 0.000818961 |
| Decile 2 | 0.000808616 |
| Decile 1 | 0.000794991 |
| Minimum | 0 |
|
|
- Mean = 0.000845126
- Std.dev = 4.92726e-05
- 20 items below graph minimum of 0.000686945
- 623 items above graph maximum of 0.00101108
|
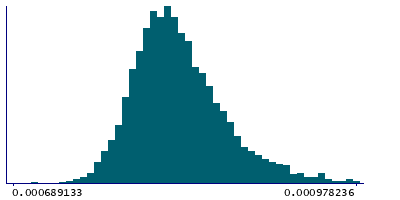
Instance 3 : First repeat imaging visit (2019+)
4,758 participants, 4,758 items
| Maximum | 0.00136521 |
| Decile 9 | 0.000881901 |
| Decile 8 | 0.000858428 |
| Decile 7 | 0.000844325 |
| Decile 6 | 0.000833209 |
| Median | 0.000823722 |
| Decile 4 | 0.000815522 |
| Decile 3 | 0.00080687 |
| Decile 2 | 0.000797805 |
| Decile 1 | 0.000785493 |
| Minimum | 0 |
|
|
- Mean = 0.000829832
- Std.dev = 4.73292e-05
- 3 items below graph minimum of 0.000689085
- 37 items above graph maximum of 0.00097831
|
Notes
Weighted-mean MD (mean diffusivity) in tract right posterior thalamic radiation (from dMRI data)
0 Related Data-Fields
There are no related data-fields
2 Applications
| Application ID | Title |
|---|
| 17689 | Genetic, environmental and lifestyle predictors of brain/cognitive-related outcomes. |
| 22783 | The joint analysis of imaging data and genetic data for early tumor detection, prevention, diagnosis and treatment |

