Data
83,909 items of data are available, covering 79,382 participants.
Defined-instances run from 2 to 3, labelled using Instancing
2.
Units of measurement are AU.
| Maximum | 0.00104368 |
| Decile 9 | 0.000808985 |
| Decile 8 | 0.000795916 |
| Decile 7 | 0.000787253 |
| Decile 6 | 0.00078013 |
| Median | 0.00077371 |
| Decile 4 | 0.00076746 |
| Decile 3 | 0.000760986 |
| Decile 2 | 0.000753369 |
| Decile 1 | 0.000743216 |
| Minimum | 0 |
|

|
- Mean = 0.000775033
- Std.dev = 3.03597e-05
- 39 items below graph minimum of 0.000677447
- 194 items above graph maximum of 0.000874755
|
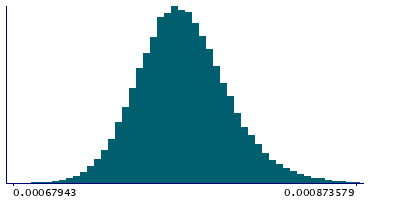
2 Instances
Instance 2 : Imaging visit (2014+)
79,151 participants, 79,151 items
| Maximum | 0.00104368 |
| Decile 9 | 0.000809196 |
| Decile 8 | 0.000796105 |
| Decile 7 | 0.00078742 |
| Decile 6 | 0.000780304 |
| Median | 0.000773873 |
| Decile 4 | 0.000767586 |
| Decile 3 | 0.000761151 |
| Decile 2 | 0.000753494 |
| Decile 1 | 0.000743285 |
| Minimum | 0 |
|
|
- Mean = 0.000775196
- Std.dev = 3.02539e-05
- 36 items below graph minimum of 0.000677375
- 182 items above graph maximum of 0.000875106
|
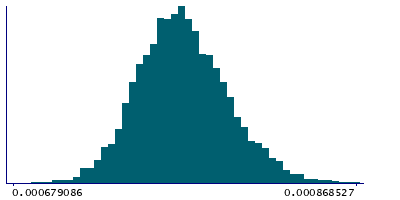
Instance 3 : First repeat imaging visit (2019+)
4,758 participants, 4,758 items
| Maximum | 0.000938779 |
| Decile 9 | 0.000805396 |
| Decile 8 | 0.000792996 |
| Decile 7 | 0.000784681 |
| Decile 6 | 0.000777455 |
| Median | 0.000771275 |
| Decile 4 | 0.000765202 |
| Decile 3 | 0.000759076 |
| Decile 2 | 0.000751631 |
| Decile 1 | 0.000742233 |
| Minimum | 0 |
|
|
- Mean = 0.00077233
- Std.dev = 3.1948e-05
- 3 items below graph minimum of 0.00067907
- 7 items above graph maximum of 0.00086856
|
Notes
Weighted-mean MD (mean diffusivity) in tract left corticospinal tract (from dMRI data)
0 Related Data-Fields
There are no related data-fields
2 Applications
| Application ID | Title |
|---|
| 17689 | Genetic, environmental and lifestyle predictors of brain/cognitive-related outcomes. |
| 22783 | The joint analysis of imaging data and genetic data for early tumor detection, prevention, diagnosis and treatment |

