Data
83,909 items of data are available, covering 79,382 participants.
Defined-instances run from 2 to 3, labelled using Instancing
2.
Units of measurement are AU.
| Maximum | 0.534748 |
| Decile 9 | 0.479002 |
| Decile 8 | 0.470694 |
| Decile 7 | 0.464564 |
| Decile 6 | 0.459211 |
| Median | 0.454041 |
| Decile 4 | 0.448793 |
| Decile 3 | 0.442873 |
| Decile 2 | 0.435688 |
| Decile 1 | 0.424863 |
| Minimum | 0 |
|

|
- Mean = 0.452489
- Std.dev = 0.0232767
- 230 items below graph minimum of 0.370725
- 1 item above graph maximum of 0.53314
|
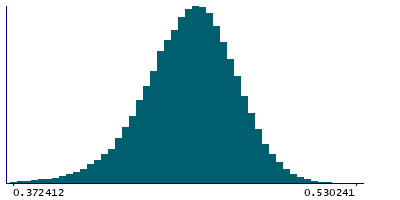
2 Instances
Instance 2 : Imaging visit (2014+)
79,151 participants, 79,151 items
| Maximum | 0.534748 |
| Decile 9 | 0.478967 |
| Decile 8 | 0.470625 |
| Decile 7 | 0.464491 |
| Decile 6 | 0.459126 |
| Median | 0.453921 |
| Decile 4 | 0.448657 |
| Decile 3 | 0.442689 |
| Decile 2 | 0.435498 |
| Decile 1 | 0.424626 |
| Minimum | 0 |
|
|
- Mean = 0.452361
- Std.dev = 0.0232654
- 216 items below graph minimum of 0.370284
- 1 item above graph maximum of 0.533309
|
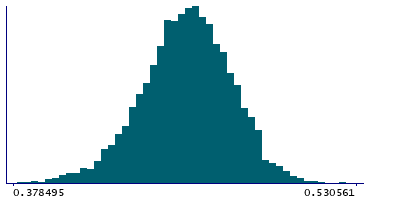
Instance 3 : First repeat imaging visit (2019+)
4,758 participants, 4,758 items
| Maximum | 0.531222 |
| Decile 9 | 0.479908 |
| Decile 8 | 0.471772 |
| Decile 7 | 0.465696 |
| Decile 6 | 0.460525 |
| Median | 0.455799 |
| Decile 4 | 0.450785 |
| Decile 3 | 0.445649 |
| Decile 2 | 0.439034 |
| Decile 1 | 0.429171 |
| Minimum | 0 |
|
|
- Mean = 0.454623
- Std.dev = 0.023361
- 16 items below graph minimum of 0.378434
- 1 item above graph maximum of 0.530645
|
Notes
Weighted-mean FA (fractional anisotropy) in tract right posterior thalamic radiation (from dMRI data)
0 Related Data-Fields
There are no related data-fields
2 Applications
| Application ID | Title |
|---|
| 17689 | Genetic, environmental and lifestyle predictors of brain/cognitive-related outcomes. |
| 22783 | The joint analysis of imaging data and genetic data for early tumor detection, prevention, diagnosis and treatment |

