Data
83,909 items of data are available, covering 79,382 participants.
Defined-instances run from 2 to 3, labelled using Instancing
2.
Units of measurement are AU.
| Maximum | 0.554738 |
| Decile 9 | 0.486676 |
| Decile 8 | 0.477948 |
| Decile 7 | 0.471346 |
| Decile 6 | 0.465607 |
| Median | 0.460162 |
| Decile 4 | 0.454453 |
| Decile 3 | 0.448164 |
| Decile 2 | 0.440467 |
| Decile 1 | 0.428352 |
| Minimum | 0 |
|
|
- Mean = 0.458322
- Std.dev = 0.0247576
- 232 items below graph minimum of 0.370027
- 2 items above graph maximum of 0.545
|
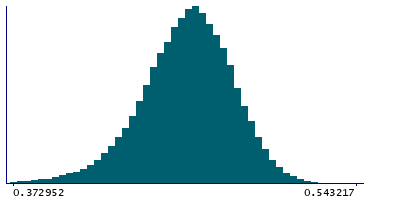
2 Instances
Instance 2 : Imaging visit (2014+)
79,151 participants, 79,151 items
| Maximum | 0.554738 |
| Decile 9 | 0.486633 |
| Decile 8 | 0.477902 |
| Decile 7 | 0.471276 |
| Decile 6 | 0.465521 |
| Median | 0.460036 |
| Decile 4 | 0.454314 |
| Decile 3 | 0.448012 |
| Decile 2 | 0.440259 |
| Decile 1 | 0.428068 |
| Minimum | 0 |
|

|
- Mean = 0.458192
- Std.dev = 0.0248009
- 215 items below graph minimum of 0.369503
- 2 items above graph maximum of 0.545197
|
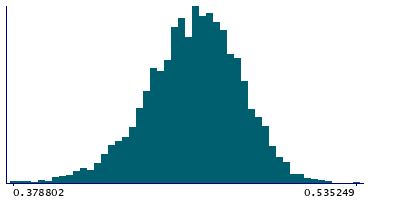
Instance 3 : First repeat imaging visit (2019+)
4,758 participants, 4,758 items
| Maximum | 0.535249 |
| Decile 9 | 0.487281 |
| Decile 8 | 0.479001 |
| Decile 7 | 0.472667 |
| Decile 6 | 0.467357 |
| Median | 0.462132 |
| Decile 4 | 0.456313 |
| Decile 3 | 0.450977 |
| Decile 2 | 0.443201 |
| Decile 1 | 0.433022 |
| Minimum | 0 |
|
|
- Mean = 0.460481
- Std.dev = 0.0239226
- 14 items below graph minimum of 0.378762
|
Notes
Weighted-mean FA (fractional anisotropy) in tract left posterior thalamic radiation (from dMRI data)
0 Related Data-Fields
There are no related data-fields
2 Applications
| Application ID | Title |
|---|
| 17689 | Genetic, environmental and lifestyle predictors of brain/cognitive-related outcomes. |
| 22783 | The joint analysis of imaging data and genetic data for early tumor detection, prevention, diagnosis and treatment |

