Data
83,909 items of data are available, covering 79,382 participants.
Defined-instances run from 2 to 3, labelled using Instancing
2.
Units of measurement are AU.
| Maximum | 0.634635 |
| Decile 9 | 0.535802 |
| Decile 8 | 0.521075 |
| Decile 7 | 0.510339 |
| Decile 6 | 0.501357 |
| Median | 0.492564 |
| Decile 4 | 0.483862 |
| Decile 3 | 0.474495 |
| Decile 2 | 0.463611 |
| Decile 1 | 0.448105 |
| Minimum | 0 |
|
|
- Mean = 0.492019
- Std.dev = 0.035375
- 45 items below graph minimum of 0.360409
- 2 items above graph maximum of 0.623498
|
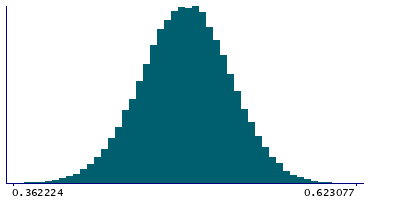
2 Instances
Instance 2 : Imaging visit (2014+)
79,151 participants, 79,151 items
| Maximum | 0.634635 |
| Decile 9 | 0.535768 |
| Decile 8 | 0.52099 |
| Decile 7 | 0.510278 |
| Decile 6 | 0.501254 |
| Median | 0.492444 |
| Decile 4 | 0.483724 |
| Decile 3 | 0.474366 |
| Decile 2 | 0.46349 |
| Decile 1 | 0.447971 |
| Minimum | 0 |
|

|
- Mean = 0.491933
- Std.dev = 0.0353625
- 42 items below graph minimum of 0.360174
- 2 items above graph maximum of 0.623565
|
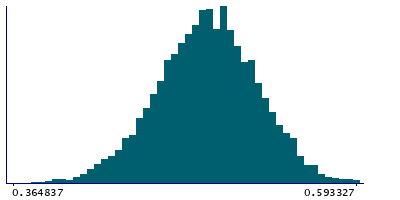
Instance 3 : First repeat imaging visit (2019+)
4,758 participants, 4,758 items
| Maximum | 0.593327 |
| Decile 9 | 0.536343 |
| Decile 8 | 0.522104 |
| Decile 7 | 0.511205 |
| Decile 6 | 0.502829 |
| Median | 0.494238 |
| Decile 4 | 0.486111 |
| Decile 3 | 0.476706 |
| Decile 2 | 0.466242 |
| Decile 1 | 0.450575 |
| Minimum | 0 |
|
|
- Mean = 0.493451
- Std.dev = 0.0355523
- 3 items below graph minimum of 0.364807
|
Notes
Weighted-mean FA (fractional anisotropy) in tract right cingulate gyrus part of cingulum (from dMRI data)
0 Related Data-Fields
There are no related data-fields
2 Applications
| Application ID | Title |
|---|
| 17689 | Genetic, environmental and lifestyle predictors of brain/cognitive-related outcomes. |
| 22783 | The joint analysis of imaging data and genetic data for early tumor detection, prevention, diagnosis and treatment |

