Data
83,909 items of data are available, covering 79,382 participants.
Defined-instances run from 2 to 3, labelled using Instancing
2.
Units of measurement are AU.
| Maximum | 0.554053 |
| Decile 9 | 0.452584 |
| Decile 8 | 0.44255 |
| Decile 7 | 0.435433 |
| Decile 6 | 0.42945 |
| Median | 0.423809 |
| Decile 4 | 0.418279 |
| Decile 3 | 0.412405 |
| Decile 2 | 0.405502 |
| Decile 1 | 0.395613 |
| Minimum | 0 |
|
|
- Mean = 0.423872
- Std.dev = 0.0238169
- 58 items below graph minimum of 0.338642
- 29 items above graph maximum of 0.509555
|
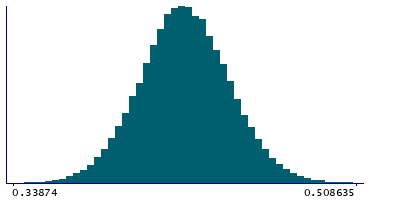
2 Instances
Instance 2 : Imaging visit (2014+)
79,151 participants, 79,151 items
| Maximum | 0.539274 |
| Decile 9 | 0.452557 |
| Decile 8 | 0.442484 |
| Decile 7 | 0.43535 |
| Decile 6 | 0.429359 |
| Median | 0.423724 |
| Decile 4 | 0.418179 |
| Decile 3 | 0.412304 |
| Decile 2 | 0.405401 |
| Decile 1 | 0.395513 |
| Minimum | 0 |
|

|
- Mean = 0.423797
- Std.dev = 0.0237655
- 54 items below graph minimum of 0.33847
- 25 items above graph maximum of 0.509601
|
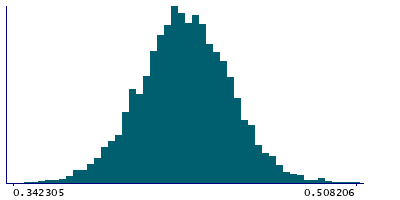
Instance 3 : First repeat imaging visit (2019+)
4,758 participants, 4,758 items
| Maximum | 0.554053 |
| Decile 9 | 0.452955 |
| Decile 8 | 0.443476 |
| Decile 7 | 0.436619 |
| Decile 6 | 0.430856 |
| Median | 0.425046 |
| Decile 4 | 0.419918 |
| Decile 3 | 0.414111 |
| Decile 2 | 0.407391 |
| Decile 1 | 0.397613 |
| Minimum | 0 |
|
|
- Mean = 0.425118
- Std.dev = 0.0246235
- 5 items below graph minimum of 0.342272
- 4 items above graph maximum of 0.508296
|
Notes
Weighted-mean FA (fractional anisotropy) in tract left acoustic radiation (from dMRI data)
0 Related Data-Fields
There are no related data-fields
2 Applications
| Application ID | Title |
|---|
| 17689 | Genetic, environmental and lifestyle predictors of brain/cognitive-related outcomes. |
| 22783 | The joint analysis of imaging data and genetic data for early tumor detection, prevention, diagnosis and treatment |

