Data
83,906 items of data are available, covering 79,379 participants.
Defined-instances run from 2 to 3, labelled using Instancing
2.
Units of measurement are AU.
| Maximum | 0.571814 |
| Decile 9 | 0.19018 |
| Decile 8 | 0.183839 |
| Decile 7 | 0.179464 |
| Decile 6 | 0.175826 |
| Median | 0.172434 |
| Decile 4 | 0.169065 |
| Decile 3 | 0.165542 |
| Decile 2 | 0.161428 |
| Decile 1 | 0.155737 |
| Minimum | 0 |
|
|
- Mean = 0.17289
- Std.dev = 0.0149289
- 12 items below graph minimum of 0.121293
- 114 items above graph maximum of 0.224624
|
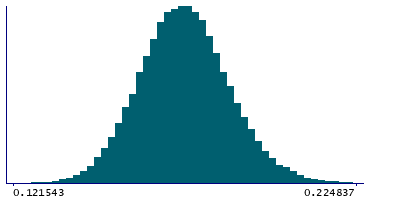
2 Instances
Instance 2 : Imaging visit (2014+)
79,148 participants, 79,148 items
| Maximum | 0.571814 |
| Decile 9 | 0.190144 |
| Decile 8 | 0.183765 |
| Decile 7 | 0.179389 |
| Decile 6 | 0.175748 |
| Median | 0.172348 |
| Decile 4 | 0.168983 |
| Decile 3 | 0.165446 |
| Decile 2 | 0.16132 |
| Decile 1 | 0.155666 |
| Minimum | 0 |
|

|
- Mean = 0.172814
- Std.dev = 0.0148863
- 11 items below graph minimum of 0.121188
- 107 items above graph maximum of 0.224623
|
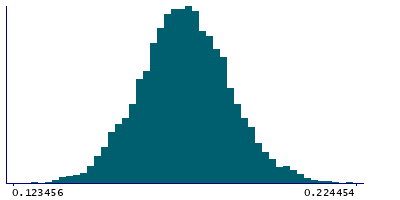
Instance 3 : First repeat imaging visit (2019+)
4,758 participants, 4,758 items
| Maximum | 0.518714 |
| Decile 9 | 0.190791 |
| Decile 8 | 0.184783 |
| Decile 7 | 0.180573 |
| Decile 6 | 0.176969 |
| Median | 0.173787 |
| Decile 4 | 0.170505 |
| Decile 3 | 0.167152 |
| Decile 2 | 0.163116 |
| Decile 1 | 0.157119 |
| Minimum | 0.115122 |
|
|
- Mean = 0.174162
- Std.dev = 0.0155655
- 1 item below graph minimum of 0.123448
- 7 items above graph maximum of 0.224462
|
Notes
Mean OD (orientation dispersion index) in external capsule (right) on FA (fractional anisotropy) skeleton (from dMRI data)
0 Related Data-Fields
There are no related data-fields
2 Applications
| Application ID | Title |
|---|
| 17689 | Genetic, environmental and lifestyle predictors of brain/cognitive-related outcomes. |
| 22783 | The joint analysis of imaging data and genetic data for early tumor detection, prevention, diagnosis and treatment |

