Data
83,906 items of data are available, covering 79,379 participants.
Defined-instances run from 2 to 3, labelled using Instancing
2.
Units of measurement are AU.
| Maximum | 0.640151 |
| Decile 9 | 0.210469 |
| Decile 8 | 0.202981 |
| Decile 7 | 0.197486 |
| Decile 6 | 0.192676 |
| Median | 0.188082 |
| Decile 4 | 0.183217 |
| Decile 3 | 0.177809 |
| Decile 2 | 0.170952 |
| Decile 1 | 0.160668 |
| Minimum | 0.091657 |
|

|
- Mean = 0.18672
- Std.dev = 0.0202585
- 32 items below graph minimum of 0.110866
- 29 items above graph maximum of 0.260271
|
2 Instances
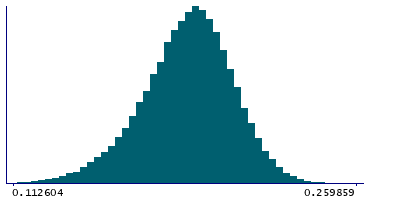
Instance 2 : Imaging visit (2014+)
79,148 participants, 79,148 items
| Maximum | 0.551322 |
| Decile 9 | 0.210472 |
| Decile 8 | 0.202973 |
| Decile 7 | 0.197456 |
| Decile 6 | 0.192655 |
| Median | 0.188055 |
| Decile 4 | 0.183163 |
| Decile 3 | 0.177754 |
| Decile 2 | 0.170852 |
| Decile 1 | 0.160509 |
| Minimum | 0.091657 |
|
|
- Mean = 0.186662
- Std.dev = 0.0202318
- 31 items below graph minimum of 0.110546
- 26 items above graph maximum of 0.260435
|
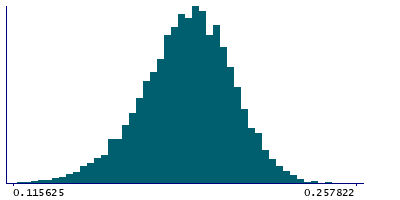
Instance 3 : First repeat imaging visit (2019+)
4,758 participants, 4,758 items
| Maximum | 0.640151 |
| Decile 9 | 0.210426 |
| Decile 8 | 0.203118 |
| Decile 7 | 0.198005 |
| Decile 6 | 0.192966 |
| Median | 0.188593 |
| Decile 4 | 0.183901 |
| Decile 3 | 0.17896 |
| Decile 2 | 0.172244 |
| Decile 1 | 0.163023 |
| Minimum | 0.102418 |
|
|
- Mean = 0.187686
- Std.dev = 0.0206731
- 2 items below graph minimum of 0.115619
- 3 items above graph maximum of 0.257829
|
Notes
Mean OD (orientation dispersion index) in superior corona radiata (right) on FA (fractional anisotropy) skeleton (from dMRI data)
0 Related Data-Fields
There are no related data-fields
2 Applications
| Application ID | Title |
|---|
| 17689 | Genetic, environmental and lifestyle predictors of brain/cognitive-related outcomes. |
| 22783 | The joint analysis of imaging data and genetic data for early tumor detection, prevention, diagnosis and treatment |

