Data
83,906 items of data are available, covering 79,379 participants.
Defined-instances run from 2 to 3, labelled using Instancing
2.
Units of measurement are AU.
| Maximum | 0.99 |
| Decile 9 | 0.607368 |
| Decile 8 | 0.580045 |
| Decile 7 | 0.559737 |
| Decile 6 | 0.542681 |
| Median | 0.526537 |
| Decile 4 | 0.510284 |
| Decile 3 | 0.492058 |
| Decile 2 | 0.469922 |
| Decile 1 | 0.436569 |
| Minimum | 0 |
|

|
- Mean = 0.523845
- Std.dev = 0.0691806
- 96 items below graph minimum of 0.26577
- 40 items above graph maximum of 0.778166
|
2 Instances
Instance 2 : Imaging visit (2014+)
79,148 participants, 79,148 items
| Maximum | 0.99 |
| Decile 9 | 0.607573 |
| Decile 8 | 0.580164 |
| Decile 7 | 0.559835 |
| Decile 6 | 0.542661 |
| Median | 0.526496 |
| Decile 4 | 0.510214 |
| Decile 3 | 0.491977 |
| Decile 2 | 0.469758 |
| Decile 1 | 0.436234 |
| Minimum | 0 |
|

|
- Mean = 0.523807
- Std.dev = 0.069326
- 90 items below graph minimum of 0.264896
- 38 items above graph maximum of 0.778911
|
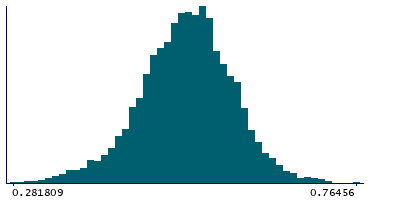
Instance 3 : First repeat imaging visit (2019+)
4,758 participants, 4,758 items
| Maximum | 0.948318 |
| Decile 9 | 0.603565 |
| Decile 8 | 0.578253 |
| Decile 7 | 0.558499 |
| Decile 6 | 0.542892 |
| Median | 0.52737 |
| Decile 4 | 0.511485 |
| Decile 3 | 0.493432 |
| Decile 2 | 0.472742 |
| Decile 1 | 0.442711 |
| Minimum | 0.221493 |
|
|
- Mean = 0.524479
- Std.dev = 0.0667107
- 9 items below graph minimum of 0.281856
- 2 items above graph maximum of 0.76442
|
Notes
Mean ICVF (intra-cellular volume fraction) in tapetum (left) on FA (fractional anisotropy) skeleton (from dMRI data)
0 Related Data-Fields
There are no related data-fields
2 Applications
| Application ID | Title |
|---|
| 17689 | Genetic, environmental and lifestyle predictors of brain/cognitive-related outcomes. |
| 22783 | The joint analysis of imaging data and genetic data for early tumor detection, prevention, diagnosis and treatment |

