Data
83,906 items of data are available, covering 79,379 participants.
Defined-instances run from 2 to 3, labelled using Instancing
2.
Units of measurement are AU.
| Maximum | 0.99 |
| Decile 9 | 0.70022 |
| Decile 8 | 0.685042 |
| Decile 7 | 0.673752 |
| Decile 6 | 0.663711 |
| Median | 0.65427 |
| Decile 4 | 0.644573 |
| Decile 3 | 0.633326 |
| Decile 2 | 0.619957 |
| Decile 1 | 0.600008 |
| Minimum | 0.275244 |
|

|
- Mean = 0.651413
- Std.dev = 0.0413561
- 271 items below graph minimum of 0.499795
- 35 items above graph maximum of 0.800432
|
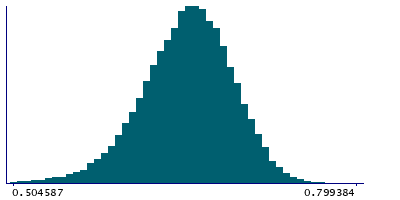
2 Instances
Instance 2 : Imaging visit (2014+)
79,148 participants, 79,148 items
| Maximum | 0.99 |
| Decile 9 | 0.700067 |
| Decile 8 | 0.684878 |
| Decile 7 | 0.673557 |
| Decile 6 | 0.663472 |
| Median | 0.654025 |
| Decile 4 | 0.644286 |
| Decile 3 | 0.632956 |
| Decile 2 | 0.61956 |
| Decile 1 | 0.599449 |
| Minimum | 0.275244 |
|
|
- Mean = 0.651099
- Std.dev = 0.0415047
- 255 items below graph minimum of 0.49883
- 31 items above graph maximum of 0.800685
|
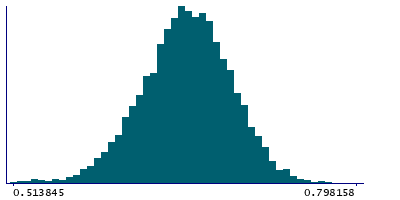
Instance 3 : First repeat imaging visit (2019+)
4,758 participants, 4,758 items
| Maximum | 0.92361 |
| Decile 9 | 0.703418 |
| Decile 8 | 0.688078 |
| Decile 7 | 0.676811 |
| Decile 6 | 0.667452 |
| Median | 0.657791 |
| Decile 4 | 0.648915 |
| Decile 3 | 0.639171 |
| Decile 2 | 0.626392 |
| Decile 1 | 0.608547 |
| Minimum | 0.456769 |
|
|
- Mean = 0.656629
- Std.dev = 0.0384273
- 11 items below graph minimum of 0.513675
- 3 items above graph maximum of 0.79829
|
Notes
Mean ICVF (intra-cellular volume fraction) in superior longitudinal fasciculus (left) on FA (fractional anisotropy) skeleton (from dMRI data)
0 Related Data-Fields
There are no related data-fields
2 Applications
| Application ID | Title |
|---|
| 17689 | Genetic, environmental and lifestyle predictors of brain/cognitive-related outcomes. |
| 22783 | The joint analysis of imaging data and genetic data for early tumor detection, prevention, diagnosis and treatment |

