Data
83,906 items of data are available, covering 79,379 participants.
Defined-instances run from 2 to 3, labelled using Instancing
2.
Units of measurement are AU.
| Maximum | 0.99 |
| Decile 9 | 0.686913 |
| Decile 8 | 0.671878 |
| Decile 7 | 0.660413 |
| Decile 6 | 0.650618 |
| Median | 0.641114 |
| Decile 4 | 0.631298 |
| Decile 3 | 0.620333 |
| Decile 2 | 0.607112 |
| Decile 1 | 0.587106 |
| Minimum | 0.238284 |
|

|
- Mean = 0.638302
- Std.dev = 0.0414367
- 304 items below graph minimum of 0.487299
- 37 items above graph maximum of 0.78672
|
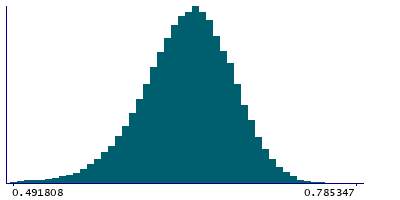
2 Instances
Instance 2 : Imaging visit (2014+)
79,148 participants, 79,148 items
| Maximum | 0.99 |
| Decile 9 | 0.686796 |
| Decile 8 | 0.671728 |
| Decile 7 | 0.660264 |
| Decile 6 | 0.650408 |
| Median | 0.640828 |
| Decile 4 | 0.630967 |
| Decile 3 | 0.62008 |
| Decile 2 | 0.606734 |
| Decile 1 | 0.586606 |
| Minimum | 0.238284 |
|
|
- Mean = 0.63801
- Std.dev = 0.0416022
- 292 items below graph minimum of 0.486416
- 33 items above graph maximum of 0.786986
|
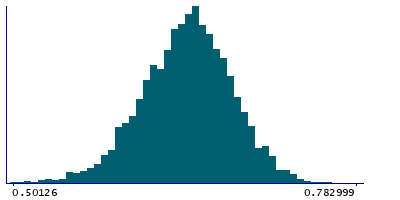
Instance 3 : First repeat imaging visit (2019+)
4,758 participants, 4,758 items
| Maximum | 0.932282 |
| Decile 9 | 0.689091 |
| Decile 8 | 0.674339 |
| Decile 7 | 0.663132 |
| Decile 6 | 0.653589 |
| Median | 0.64511 |
| Decile 4 | 0.636037 |
| Decile 3 | 0.625737 |
| Decile 2 | 0.612934 |
| Decile 1 | 0.595172 |
| Minimum | 0.427264 |
|
|
- Mean = 0.64317
- Std.dev = 0.0382521
- 13 items below graph minimum of 0.501253
- 3 items above graph maximum of 0.783011
|
Notes
Mean ICVF (intra-cellular volume fraction) in superior longitudinal fasciculus (right) on FA (fractional anisotropy) skeleton (from dMRI data)
0 Related Data-Fields
There are no related data-fields
2 Applications
| Application ID | Title |
|---|
| 17689 | Genetic, environmental and lifestyle predictors of brain/cognitive-related outcomes. |
| 22783 | The joint analysis of imaging data and genetic data for early tumor detection, prevention, diagnosis and treatment |

