Data
83,906 items of data are available, covering 79,379 participants.
Defined-instances run from 2 to 3, labelled using Instancing
2.
Units of measurement are AU.
| Maximum | 0.989998 |
| Decile 9 | 0.586067 |
| Decile 8 | 0.568945 |
| Decile 7 | 0.556231 |
| Decile 6 | 0.545184 |
| Median | 0.534694 |
| Decile 4 | 0.523728 |
| Decile 3 | 0.511327 |
| Decile 2 | 0.496209 |
| Decile 1 | 0.473861 |
| Minimum | 0 |
|
|
- Mean = 0.531821
- Std.dev = 0.0454995
- 115 items below graph minimum of 0.361656
- 27 items above graph maximum of 0.698272
|
2 Instances
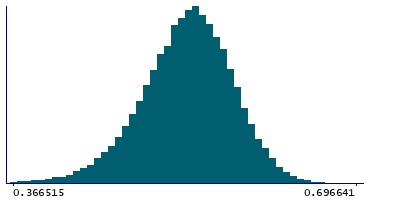
Instance 2 : Imaging visit (2014+)
79,148 participants, 79,148 items
| Maximum | 0.989998 |
| Decile 9 | 0.585841 |
| Decile 8 | 0.568696 |
| Decile 7 | 0.555962 |
| Decile 6 | 0.544892 |
| Median | 0.534359 |
| Decile 4 | 0.523328 |
| Decile 3 | 0.510907 |
| Decile 2 | 0.495771 |
| Decile 1 | 0.473399 |
| Minimum | 0 |
|

|
- Mean = 0.531458
- Std.dev = 0.045608
- 107 items below graph minimum of 0.360957
- 25 items above graph maximum of 0.698283
|
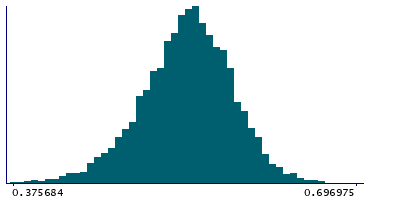
Instance 3 : First repeat imaging visit (2019+)
4,758 participants, 4,758 items
| Maximum | 0.896484 |
| Decile 9 | 0.589897 |
| Decile 8 | 0.572978 |
| Decile 7 | 0.560635 |
| Decile 6 | 0.549701 |
| Median | 0.540041 |
| Decile 4 | 0.530044 |
| Decile 3 | 0.518849 |
| Decile 2 | 0.504248 |
| Decile 1 | 0.482761 |
| Minimum | 0.33445 |
|
|
- Mean = 0.537856
- Std.dev = 0.0432113
- 6 items below graph minimum of 0.375624
- 2 items above graph maximum of 0.697033
|
Notes
Mean ICVF (intra-cellular volume fraction) in posterior thalamic radiation (left) on FA (fractional anisotropy) skeleton (from dMRI data)
0 Related Data-Fields
There are no related data-fields
2 Applications
| Application ID | Title |
|---|
| 17689 | Genetic, environmental and lifestyle predictors of brain/cognitive-related outcomes. |
| 22783 | The joint analysis of imaging data and genetic data for early tumor detection, prevention, diagnosis and treatment |

