Data
83,911 items of data are available, covering 79,384 participants.
Defined-instances run from 2 to 3, labelled using Instancing
2.
Units of measurement are AU.
| Maximum | 0.001332 |
| Decile 9 | 0.00044 |
| Decile 8 | 0.000419 |
| Decile 7 | 0.000406 |
| Decile 6 | 0.000396 |
| Median | 0.000387 |
| Decile 4 | 0.000378 |
| Decile 3 | 0.00037 |
| Decile 2 | 0.000361 |
| Decile 1 | 0.000349 |
| Minimum | 0.000101 |
|
|
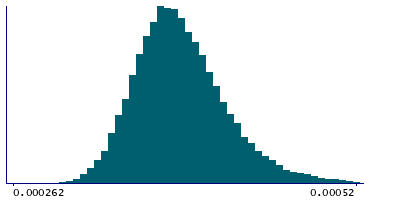
- Mean = 0.000391873
- Std.dev = 4.0183e-05
- 3 items below graph minimum of 0.000258
- 658 items above graph maximum of 0.000531
|
2 Instances
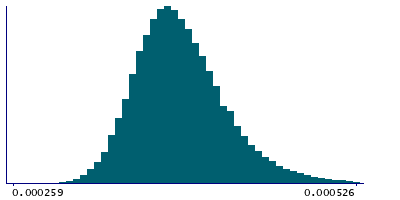
Instance 2 : Imaging visit (2014+)
79,153 participants, 79,153 items
| Maximum | 0.001332 |
| Decile 9 | 0.00044 |
| Decile 8 | 0.000419 |
| Decile 7 | 0.000406 |
| Decile 6 | 0.000396 |
| Median | 0.000387 |
| Decile 4 | 0.000379 |
| Decile 3 | 0.00037 |
| Decile 2 | 0.000361 |
| Decile 1 | 0.000349 |
| Minimum | 0.000184 |
|
|
- Mean = 0.000392196
- Std.dev = 4.04022e-05
- 2 items below graph minimum of 0.000258
- 638 items above graph maximum of 0.000531
|
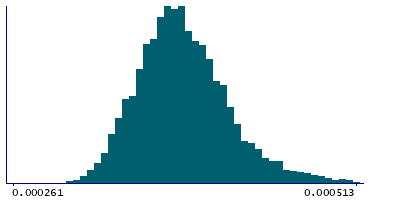
Instance 3 : First repeat imaging visit (2019+)
4,758 participants, 4,758 items
| Maximum | 0.00068 |
| Decile 9 | 0.000429 |
| Decile 8 | 0.000412 |
| Decile 7 | 0.0004005 |
| Decile 6 | 0.000391 |
| Median | 0.000383 |
| Decile 4 | 0.000375 |
| Decile 3 | 0.000367 |
| Decile 2 | 0.000358 |
| Decile 1 | 0.000345 |
| Minimum | 0.000101 |
|
|
- Mean = 0.000386503
- Std.dev = 3.59197e-05
- 1 item below graph minimum of 0.000261
- 23 items above graph maximum of 0.000513
|
Notes
Mean L3 in superior longitudinal fasciculus (right) on FA (fractional anisotropy) skeleton (from dMRI data)
0 Related Data-Fields
There are no related data-fields
2 Applications
| Application ID | Title |
|---|
| 17689 | Genetic, environmental and lifestyle predictors of brain/cognitive-related outcomes. |
| 22783 | The joint analysis of imaging data and genetic data for early tumor detection, prevention, diagnosis and treatment |

