Data
83,911 items of data are available, covering 79,384 participants.
Defined-instances run from 2 to 3, labelled using Instancing
2.
Units of measurement are AU.
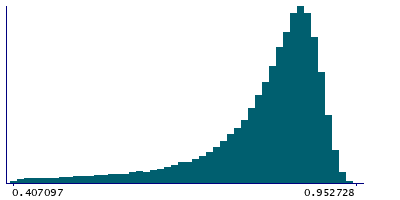
| Maximum | 0.952728 |
| Decile 9 | 0.892392 |
| Decile 8 | 0.876121 |
| Decile 7 | 0.861907 |
| Decile 6 | 0.847363 |
| Median | 0.830468 |
| Decile 4 | 0.809659 |
| Decile 3 | 0.781298 |
| Decile 2 | 0.736085 |
| Decile 1 | 0.636837 |
| Minimum | -0.474983 |
|
|
- Mean = 0.791355
- Std.dev = 0.123877
- 1555 items below graph minimum of 0.381283
|
2 Instances
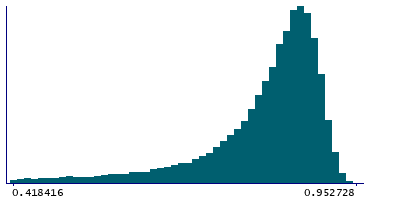
Instance 2 : Imaging visit (2014+)
79,153 participants, 79,153 items
| Maximum | 0.952728 |
| Decile 9 | 0.892516 |
| Decile 8 | 0.876251 |
| Decile 7 | 0.862 |
| Decile 6 | 0.847389 |
| Median | 0.830491 |
| Decile 4 | 0.809592 |
| Decile 3 | 0.781127 |
| Decile 2 | 0.735639 |
| Decile 1 | 0.635949 |
| Minimum | -0.474983 |
|
|
- Mean = 0.791188
- Std.dev = 0.124211
- 1466 items below graph minimum of 0.379382
|
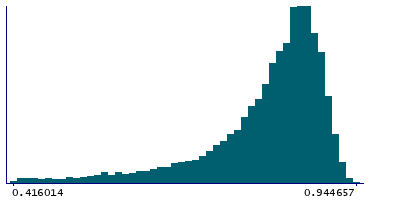
Instance 3 : First repeat imaging visit (2019+)
4,758 participants, 4,758 items
| Maximum | 0.944657 |
| Decile 9 | 0.89028 |
| Decile 8 | 0.873934 |
| Decile 7 | 0.86038 |
| Decile 6 | 0.847033 |
| Median | 0.830113 |
| Decile 4 | 0.810953 |
| Decile 3 | 0.784122 |
| Decile 2 | 0.742185 |
| Decile 1 | 0.653097 |
| Minimum | -0.129354 |
|
|
- Mean = 0.794129
- Std.dev = 0.118155
- 104 items below graph minimum of 0.415915
|
Notes
Mean MO (diffusion tensor mode) in fornix on FA (fractional anisotropy) skeleton (from dMRI data)
0 Related Data-Fields
There are no related data-fields
2 Applications
| Application ID | Title |
|---|
| 17689 | Genetic, environmental and lifestyle predictors of brain/cognitive-related outcomes. |
| 22783 | The joint analysis of imaging data and genetic data for early tumor detection, prevention, diagnosis and treatment |

