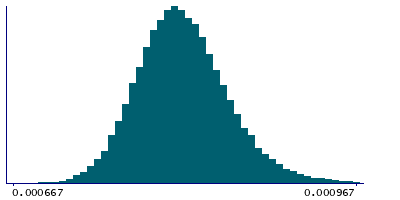
Data
83,911 items of data are available, covering 79,384 participants.
Defined-instances run from 2 to 3, labelled using Instancing
2.
Units of measurement are AU.
| Maximum | 0.001607 |
| Decile 9 | 0.000874 |
| Decile 8 | 0.000853 |
| Decile 7 | 0.000839 |
| Decile 6 | 0.000828 |
| Median | 0.000817 |
| Decile 4 | 0.000808 |
| Decile 3 | 0.000797 |
| Decile 2 | 0.000786 |
| Decile 1 | 0.00077 |
| Minimum | 0 |
|
|
- Mean = 0.000820528
- Std.dev = 4.31086e-05
- 16 items below graph minimum of 0.000666
- 275 items above graph maximum of 0.000978
|
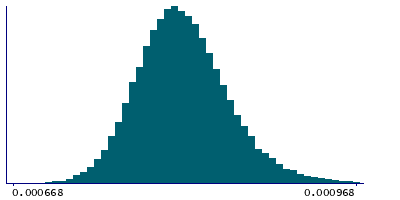
2 Instances
Instance 2 : Imaging visit (2014+)
79,153 participants, 79,153 items
| Maximum | 0.001607 |
| Decile 9 | 0.000875 |
| Decile 8 | 0.000854 |
| Decile 7 | 0.00084 |
| Decile 6 | 0.000828 |
| Median | 0.000818 |
| Decile 4 | 0.000808 |
| Decile 3 | 0.000798 |
| Decile 2 | 0.000787 |
| Decile 1 | 0.000771 |
| Minimum | 0 |
|
|
- Mean = 0.000821377
- Std.dev = 4.31944e-05
- 16 items below graph minimum of 0.000667
- 259 items above graph maximum of 0.000979
|
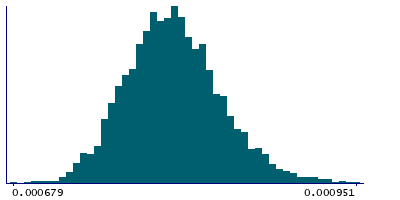
Instance 3 : First repeat imaging visit (2019+)
4,758 participants, 4,758 items
| Maximum | 0.001041 |
| Decile 9 | 0.000855 |
| Decile 8 | 0.000836 |
| Decile 7 | 0.000824 |
| Decile 6 | 0.000813 |
| Median | 0.000804 |
| Decile 4 | 0.000795 |
| Decile 3 | 0.000785 |
| Decile 2 | 0.000774 |
| Decile 1 | 0.000759 |
| Minimum | 0.000679 |
|
|
- Mean = 0.000806397
- Std.dev = 3.90321e-05
- 16 items above graph maximum of 0.000951
|
Notes
Mean MD (mean diffusivity) in sagittal stratum (right) on FA (fractional anisotropy) skeleton (from dMRI data)
0 Related Data-Fields
There are no related data-fields
2 Applications
| Application ID | Title |
|---|
| 17689 | Genetic, environmental and lifestyle predictors of brain/cognitive-related outcomes. |
| 22783 | The joint analysis of imaging data and genetic data for early tumor detection, prevention, diagnosis and treatment |

