Data
83,911 items of data are available, covering 79,384 participants.
Defined-instances run from 2 to 3, labelled using Instancing
2.
Units of measurement are AU.
| Maximum | 0.00158 |
| Decile 9 | 0.000839 |
| Decile 8 | 0.00082 |
| Decile 7 | 0.000807 |
| Decile 6 | 0.000797 |
| Median | 0.000788 |
| Decile 4 | 0.000779 |
| Decile 3 | 0.00077 |
| Decile 2 | 0.000759 |
| Decile 1 | 0.000746 |
| Minimum | 0 |
|
|
- Mean = 0.000790493
- Std.dev = 3.79785e-05
- 9 items below graph minimum of 0.000653
- 133 items above graph maximum of 0.000932
|
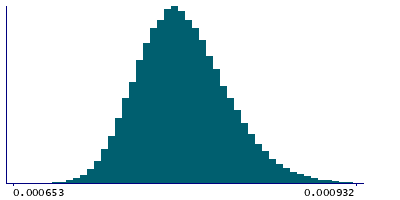
2 Instances
Instance 2 : Imaging visit (2014+)
79,153 participants, 79,153 items
| Maximum | 0.00158 |
| Decile 9 | 0.000839 |
| Decile 8 | 0.000821 |
| Decile 7 | 0.000808 |
| Decile 6 | 0.000798 |
| Median | 0.000788 |
| Decile 4 | 0.000779 |
| Decile 3 | 0.00077 |
| Decile 2 | 0.00076 |
| Decile 1 | 0.000746 |
| Minimum | 0 |
|

|
- Mean = 0.000791012
- Std.dev = 3.80502e-05
- 8 items below graph minimum of 0.000653
- 131 items above graph maximum of 0.000932
|
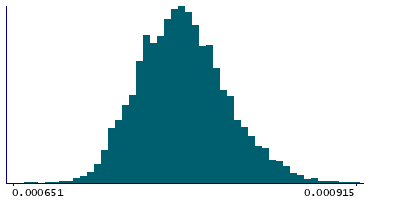
Instance 3 : First repeat imaging visit (2019+)
4,758 participants, 4,758 items
| Maximum | 0.001378 |
| Decile 9 | 0.000827 |
| Decile 8 | 0.000809 |
| Decile 7 | 0.000798 |
| Decile 6 | 0.000788 |
| Median | 0.00078 |
| Decile 4 | 0.000772 |
| Decile 3 | 0.000763 |
| Decile 2 | 0.000752 |
| Decile 1 | 0.000739 |
| Minimum | 0.000522 |
|
|
- Mean = 0.000781869
- Std.dev = 3.56773e-05
- 1 item below graph minimum of 0.000651
- 6 items above graph maximum of 0.000915
|
Notes
Mean MD (mean diffusivity) in superior cerebellar peduncle (left) on FA (fractional anisotropy) skeleton (from dMRI data)
0 Related Data-Fields
There are no related data-fields
2 Applications
| Application ID | Title |
|---|
| 17689 | Genetic, environmental and lifestyle predictors of brain/cognitive-related outcomes. |
| 22783 | The joint analysis of imaging data and genetic data for early tumor detection, prevention, diagnosis and treatment |

