Data
83,911 items of data are available, covering 79,384 participants.
Defined-instances run from 2 to 3, labelled using Instancing
2.
Units of measurement are AU.
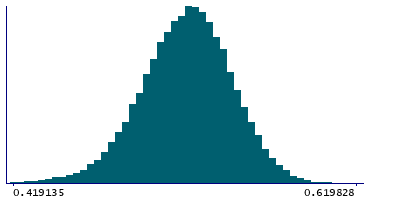
| Maximum | 0.695055 |
| Decile 9 | 0.552945 |
| Decile 8 | 0.542129 |
| Decile 7 | 0.534161 |
| Decile 6 | 0.527348 |
| Median | 0.520946 |
| Decile 4 | 0.514152 |
| Decile 3 | 0.506784 |
| Decile 2 | 0.498005 |
| Decile 1 | 0.485208 |
| Minimum | 0.240856 |
|
|
- Mean = 0.519443
- Std.dev = 0.0276162
- 246 items below graph minimum of 0.417472
- 1 item above graph maximum of 0.620682
|
2 Instances
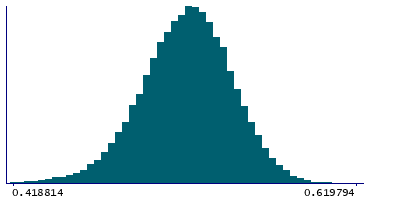
Instance 2 : Imaging visit (2014+)
79,153 participants, 79,153 items
| Maximum | 0.619794 |
| Decile 9 | 0.55293 |
| Decile 8 | 0.542097 |
| Decile 7 | 0.534115 |
| Decile 6 | 0.527287 |
| Median | 0.520886 |
| Decile 4 | 0.514065 |
| Decile 3 | 0.506682 |
| Decile 2 | 0.497915 |
| Decile 1 | 0.485017 |
| Minimum | 0.240856 |
|
|
- Mean = 0.519355
- Std.dev = 0.0276823
- 233 items below graph minimum of 0.417105
|
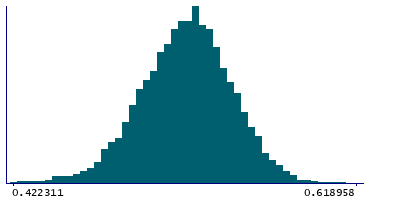
Instance 3 : First repeat imaging visit (2019+)
4,758 participants, 4,758 items
| Maximum | 0.695055 |
| Decile 9 | 0.553422 |
| Decile 8 | 0.542877 |
| Decile 7 | 0.534947 |
| Decile 6 | 0.528213 |
| Median | 0.522032 |
| Decile 4 | 0.515521 |
| Decile 3 | 0.508374 |
| Decile 2 | 0.499638 |
| Decile 1 | 0.487835 |
| Minimum | 0.373116 |
|
|
- Mean = 0.520906
- Std.dev = 0.0264484
- 8 items below graph minimum of 0.422249
- 1 item above graph maximum of 0.619009
|
Notes
Mean FA (fractional anisotropy) in superior longitudinal fasciculus (right) on FA skeleton (from dMRI data)
0 Related Data-Fields
There are no related data-fields
2 Applications
| Application ID | Title |
|---|
| 17689 | Genetic, environmental and lifestyle predictors of brain/cognitive-related outcomes. |
| 22783 | The joint analysis of imaging data and genetic data for early tumor detection, prevention, diagnosis and treatment |

