Data
83,911 items of data are available, covering 79,384 participants.
Defined-instances run from 2 to 3, labelled using Instancing
2.
Units of measurement are AU.
| Maximum | 0.73359 |
| Decile 9 | 0.661938 |
| Decile 8 | 0.648962 |
| Decile 7 | 0.639248 |
| Decile 6 | 0.630777 |
| Median | 0.622553 |
| Decile 4 | 0.614277 |
| Decile 3 | 0.605022 |
| Decile 2 | 0.593746 |
| Decile 1 | 0.577511 |
| Minimum | 0.161485 |
|
|
- Mean = 0.620762
- Std.dev = 0.0338495
- 124 items below graph minimum of 0.493084
|
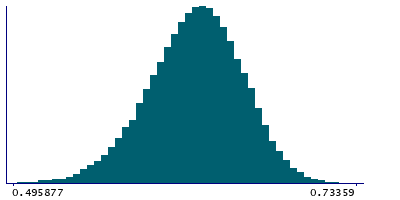
2 Instances
Instance 2 : Imaging visit (2014+)
79,153 participants, 79,153 items
| Maximum | 0.73359 |
| Decile 9 | 0.661877 |
| Decile 8 | 0.648882 |
| Decile 7 | 0.639174 |
| Decile 6 | 0.630721 |
| Median | 0.622476 |
| Decile 4 | 0.614169 |
| Decile 3 | 0.604853 |
| Decile 2 | 0.593581 |
| Decile 1 | 0.577273 |
| Minimum | 0.161485 |
|

|
- Mean = 0.620645
- Std.dev = 0.0339246
- 119 items below graph minimum of 0.492669
|
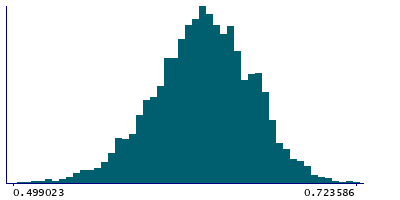
Instance 3 : First repeat imaging visit (2019+)
4,758 participants, 4,758 items
| Maximum | 0.723586 |
| Decile 9 | 0.662701 |
| Decile 8 | 0.650699 |
| Decile 7 | 0.640591 |
| Decile 6 | 0.631877 |
| Median | 0.623721 |
| Decile 4 | 0.616202 |
| Decile 3 | 0.607342 |
| Decile 2 | 0.596672 |
| Decile 1 | 0.580821 |
| Minimum | 0.439486 |
|
|
- Mean = 0.62271
- Std.dev = 0.0325128
- 4 items below graph minimum of 0.498942
|
Notes
Mean FA (fractional anisotropy) in cingulum cingulate gyrus (left) on FA skeleton (from dMRI data)
0 Related Data-Fields
There are no related data-fields
2 Applications
| Application ID | Title |
|---|
| 17689 | Genetic, environmental and lifestyle predictors of brain/cognitive-related outcomes. |
| 22783 | The joint analysis of imaging data and genetic data for early tumor detection, prevention, diagnosis and treatment |

