Data
83,911 items of data are available, covering 79,384 participants.
Defined-instances run from 2 to 3, labelled using Instancing
2.
Units of measurement are AU.
| Maximum | 0.741926 |
| Decile 9 | 0.522363 |
| Decile 8 | 0.511396 |
| Decile 7 | 0.503439 |
| Decile 6 | 0.49674 |
| Median | 0.490152 |
| Decile 4 | 0.483835 |
| Decile 3 | 0.476959 |
| Decile 2 | 0.468637 |
| Decile 1 | 0.456379 |
| Minimum | 0.167592 |
|
|
- Mean = 0.489678
- Std.dev = 0.0262962
- 97 items below graph minimum of 0.390394
- 9 items above graph maximum of 0.588348
|
2 Instances
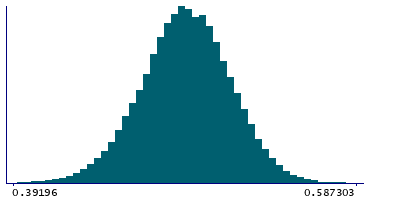
Instance 2 : Imaging visit (2014+)
79,153 participants, 79,153 items
| Maximum | 0.626107 |
| Decile 9 | 0.522315 |
| Decile 8 | 0.511268 |
| Decile 7 | 0.503329 |
| Decile 6 | 0.496591 |
| Median | 0.490015 |
| Decile 4 | 0.48366 |
| Decile 3 | 0.476791 |
| Decile 2 | 0.468449 |
| Decile 1 | 0.456199 |
| Minimum | 0.167592 |
|

|
- Mean = 0.489534
- Std.dev = 0.0263299
- 92 items below graph minimum of 0.390083
- 8 items above graph maximum of 0.588432
|
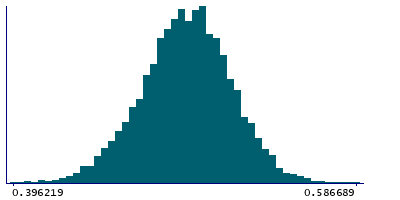
Instance 3 : First repeat imaging visit (2019+)
4,758 participants, 4,758 items
| Maximum | 0.741926 |
| Decile 9 | 0.523227 |
| Decile 8 | 0.512869 |
| Decile 7 | 0.505406 |
| Decile 6 | 0.499062 |
| Median | 0.492721 |
| Decile 4 | 0.486621 |
| Decile 3 | 0.479782 |
| Decile 2 | 0.471774 |
| Decile 1 | 0.459699 |
| Minimum | 0.332332 |
|
|
- Mean = 0.492073
- Std.dev = 0.0256105
- 4 items below graph minimum of 0.39617
- 1 item above graph maximum of 0.586755
|
Notes
Mean FA (fractional anisotropy) in superior corona radiata (left) on FA skeleton (from dMRI data)
0 Related Data-Fields
There are no related data-fields
2 Applications
| Application ID | Title |
|---|
| 17689 | Genetic, environmental and lifestyle predictors of brain/cognitive-related outcomes. |
| 22783 | The joint analysis of imaging data and genetic data for early tumor detection, prevention, diagnosis and treatment |

