Data
507,960 items of data are available, covering 488,512 participants.
Defined-instances run from 0 to 1, labelled using Instancing
2.
Units of measurement are percent.
| Maximum | 99.942 |
| Decile 9 | 7.78495 |
| Decile 8 | 6.81645 |
| Decile 7 | 6.15784 |
| Decile 6 | 5.62501 |
| Median | 5.15213 |
| Decile 4 | 4.6968 |
| Decile 3 | 4.2358 |
| Decile 2 | 3.7244 |
| Decile 1 | 3.0822 |
| Minimum | 5.817e-05 |
|
|
- Mean = 5.32588
- Std.dev = 1.87666
- 742 items above graph maximum of 12.4877
|
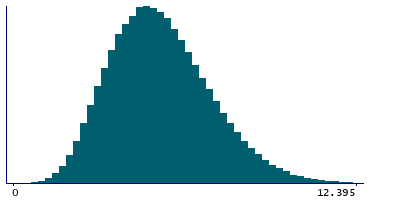
2 Instances
Instance 0 : Initial assessment visit (2006-2010) at which participants were recruited and consent given
488,083 participants, 488,083 items
| Maximum | 99.942 |
| Decile 9 | 7.8 |
| Decile 8 | 6.8294 |
| Decile 7 | 6.1689 |
| Decile 6 | 5.63395 |
| Median | 5.1596 |
| Decile 4 | 4.70319 |
| Decile 3 | 4.24036 |
| Decile 2 | 3.7278 |
| Decile 1 | 3.08405 |
| Minimum | 5.817e-05 |
|

|
- Mean = 5.33438
- Std.dev = 1.88288
- 718 items above graph maximum of 12.5159
|
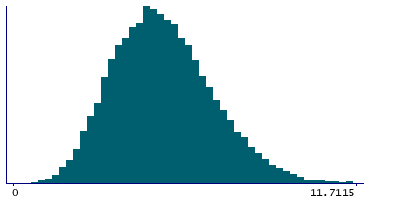
Instance 1 : First repeat assessment visit (2012-13)
19,877 participants, 19,877 items
| Maximum | 17.0521 |
| Decile 9 | 7.3792 |
| Decile 8 | 6.50495 |
| Decile 7 | 5.9002 |
| Decile 6 | 5.4226 |
| Median | 4.9755 |
| Decile 4 | 4.56565 |
| Decile 3 | 4.12589 |
| Decile 2 | 3.63754 |
| Decile 1 | 3.03817 |
| Minimum | 0.344251 |
|
|
- Mean = 5.11726
- Std.dev = 1.70371
- 22 items above graph maximum of 11.7202
|


