Data
507,960 items of data are available, covering 488,512 participants.
Defined-instances run from 0 to 1, labelled using Instancing
2.
Units of measurement are percent.
| Maximum | 20.5309 |
| Decile 9 | 11.049 |
| Decile 8 | 10.797 |
| Decile 7 | 10.596 |
| Decile 6 | 10.4031 |
| Median | 10.2048 |
| Decile 4 | 9.9773 |
| Decile 3 | 9.69581 |
| Decile 2 | 9.30387 |
| Decile 1 | 8.6149 |
| Minimum | 1.8828e-05 |
|

|
- Mean = 9.94813
- Std.dev = 1.2131
- 7531 items below graph minimum of 6.18081
- 74 items above graph maximum of 13.4831
|
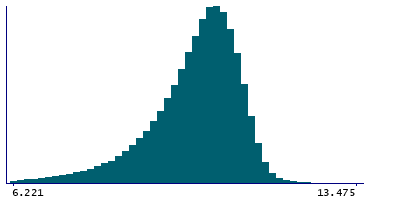
2 Instances
Instance 0 : Initial assessment visit (2006-2010) at which participants were recruited and consent given
488,083 participants, 488,083 items
| Maximum | 20.5309 |
| Decile 9 | 11.046 |
| Decile 8 | 10.794 |
| Decile 7 | 10.5921 |
| Decile 6 | 10.3998 |
| Median | 10.201 |
| Decile 4 | 9.97351 |
| Decile 3 | 9.69266 |
| Decile 2 | 9.30105 |
| Decile 1 | 8.61163 |
| Minimum | 1.8828e-05 |
|
|
- Mean = 9.94472
- Std.dev = 1.21428
- 7240 items below graph minimum of 6.17725
- 73 items above graph maximum of 13.4804
|
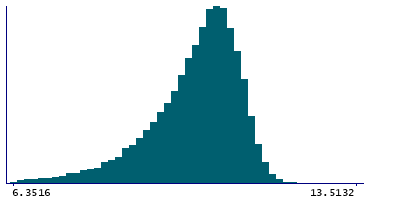
Instance 1 : First repeat assessment visit (2012-13)
19,877 participants, 19,877 items
| Maximum | 14.018 |
| Decile 9 | 11.12 |
| Decile 8 | 10.8749 |
| Decile 7 | 10.679 |
| Decile 6 | 10.491 |
| Median | 10.2966 |
| Decile 4 | 10.068 |
| Decile 3 | 9.78023 |
| Decile 2 | 9.37625 |
| Decile 1 | 8.69418 |
| Minimum | 0.00059384 |
|
|
- Mean = 10.0318
- Std.dev = 1.18071
- 286 items below graph minimum of 6.26836
- 1 item above graph maximum of 13.5458
|


