Data
507,721 items of data are available, covering 488,283 participants.
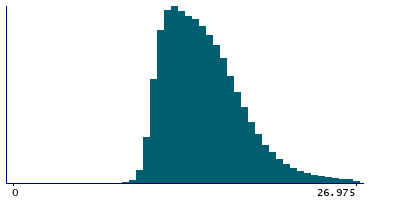
Defined-instances run from 0 to 1, labelled using Instancing
2.
Units of measurement are percent.
| Maximum | 81.6686 |
| Decile 9 | 19.45 |
| Decile 8 | 17.547 |
| Decile 7 | 16.363 |
| Decile 6 | 15.4093 |
| Median | 14.552 |
| Decile 4 | 13.749 |
| Decile 3 | 12.978 |
| Decile 2 | 12.246 |
| Decile 1 | 11.4893 |
| Minimum | 0.0013479 |
|
|
- Mean = 15.2339
- Std.dev = 3.83535
- 6458 items above graph maximum of 27.4107
|
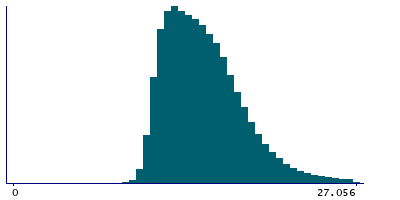
2 Instances
Instance 0 : Initial assessment visit (2006-2010) at which participants were recruited and consent given
487,850 participants, 487,850 items
| Maximum | 81.6686 |
| Decile 9 | 19.4813 |
| Decile 8 | 17.576 |
| Decile 7 | 16.391 |
| Decile 6 | 15.438 |
| Median | 14.579 |
| Decile 4 | 13.773 |
| Decile 3 | 12.999 |
| Decile 2 | 12.262 |
| Decile 1 | 11.499 |
| Minimum | 0.0013479 |
|
|
- Mean = 15.2575
- Std.dev = 3.84189
- 6205 items above graph maximum of 27.4636
|
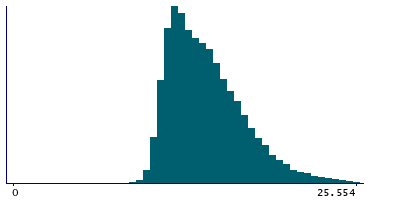
Instance 1 : First repeat assessment visit (2012-13)
19,871 participants, 19,871 items
| Maximum | 68.999 |
| Decile 9 | 18.5865 |
| Decile 8 | 16.77 |
| Decile 7 | 15.6228 |
| Decile 6 | 14.7225 |
| Median | 13.9397 |
| Decile 4 | 13.205 |
| Decile 3 | 12.539 |
| Decile 2 | 11.9426 |
| Decile 1 | 11.317 |
| Minimum | 0.20589 |
|
|
- Mean = 14.6567
- Std.dev = 3.62369
- 268 items above graph maximum of 25.856
|


