Data
507,960 items of data are available, covering 488,512 participants.
Defined-instances run from 0 to 1, labelled using Instancing
2.
Units of measurement are percent.
| Maximum | 75.2 |
| Decile 9 | 7.3048 |
| Decile 8 | 6.3866 |
| Decile 7 | 5.84049 |
| Decile 6 | 5.4413 |
| Median | 5.11257 |
| Decile 4 | 4.8264 |
| Decile 3 | 4.56254 |
| Decile 2 | 4.2926 |
| Decile 1 | 3.97083 |
| Minimum | 1.8199 |
|
|
- Mean = 5.45169
- Std.dev = 1.58521
- 5244 items above graph maximum of 10.6388
|
2 Instances
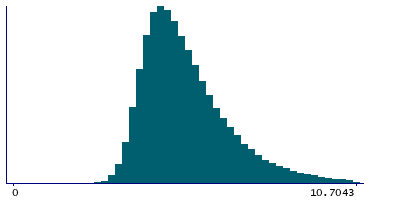
Instance 0 : Initial assessment visit (2006-2010) at which participants were recruited and consent given
488,083 participants, 488,083 items
| Maximum | 75.2 |
| Decile 9 | 7.30526 |
| Decile 8 | 6.38417 |
| Decile 7 | 5.83805 |
| Decile 6 | 5.4379 |
| Median | 5.10906 |
| Decile 4 | 4.8236 |
| Decile 3 | 4.5598 |
| Decile 2 | 4.28993 |
| Decile 1 | 3.9683 |
| Minimum | 1.8199 |
|

|
- Mean = 5.45023
- Std.dev = 1.59076
- 5086 items above graph maximum of 10.6422
|
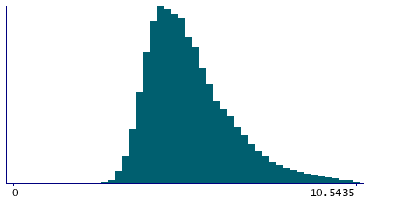
Instance 1 : First repeat assessment visit (2012-13)
19,877 participants, 19,877 items
| Maximum | 23.826 |
| Decile 9 | 7.2939 |
| Decile 8 | 6.44433 |
| Decile 7 | 5.90175 |
| Decile 6 | 5.5135 |
| Median | 5.1903 |
| Decile 4 | 4.90695 |
| Decile 3 | 4.62965 |
| Decile 2 | 4.3616 |
| Decile 1 | 4.0347 |
| Minimum | 2.57607 |
|
|
- Mean = 5.48748
- Std.dev = 1.44169
- 152 items above graph maximum of 10.5531
|


