Data
507,960 items of data are available, covering 488,512 participants.
Defined-instances run from 0 to 1, labelled using Instancing
2.
Units of measurement are mmol/l.
| Maximum | 0.327354 |
| Decile 9 | 0.080379 |
| Decile 8 | 0.0695204 |
| Decile 7 | 0.0626495 |
| Decile 6 | 0.057262 |
| Median | 0.052623 |
| Decile 4 | 0.048231 |
| Decile 3 | 0.0438022 |
| Decile 2 | 0.038955 |
| Decile 1 | 0.032725 |
| Minimum | 5.3219e-08 |
|
|
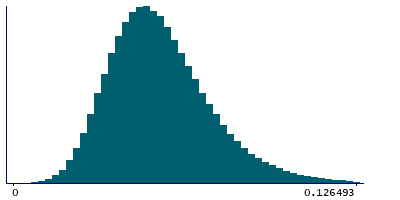
- Mean = 0.0551198
- Std.dev = 0.0197195
- 2217 items above graph maximum of 0.128033
|
2 Instances
Instance 0 : Initial assessment visit (2006-2010) at which participants were recruited and consent given
488,083 participants, 488,083 items
| Maximum | 0.327354 |
| Decile 9 | 0.0804799 |
| Decile 8 | 0.0695904 |
| Decile 7 | 0.062703 |
| Decile 6 | 0.057304 |
| Median | 0.0526577 |
| Decile 4 | 0.0482584 |
| Decile 3 | 0.043817 |
| Decile 2 | 0.038954 |
| Decile 1 | 0.03271 |
| Minimum | 5.3219e-08 |
|
|
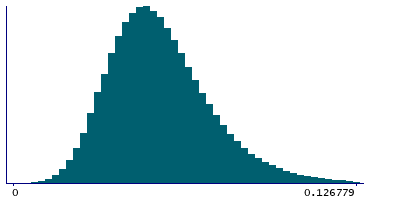
- Mean = 0.0551668
- Std.dev = 0.0197758
- 2139 items above graph maximum of 0.12825
|
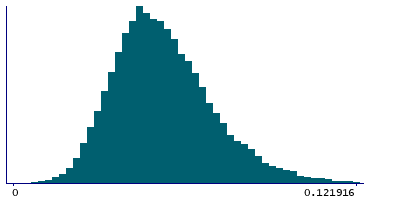
Instance 1 : First repeat assessment visit (2012-13)
19,877 participants, 19,877 items
| Maximum | 0.17264 |
| Decile 9 | 0.0777775 |
| Decile 8 | 0.067556 |
| Decile 7 | 0.0613615 |
| Decile 6 | 0.0561864 |
| Median | 0.051769 |
| Decile 4 | 0.0475308 |
| Decile 3 | 0.0435005 |
| Decile 2 | 0.0389975 |
| Decile 1 | 0.032959 |
| Minimum | 0.00495812 |
|
|
- Mean = 0.053966
- Std.dev = 0.0182451
- 67 items above graph maximum of 0.122596
|


