Data
507,960 items of data are available, covering 488,512 participants.
Defined-instances run from 0 to 1, labelled using Instancing
2.
Units of measurement are mmol/l.
| Maximum | 0.012973 |
| Decile 9 | 0.0052099 |
| Decile 8 | 0.0047193 |
| Decile 7 | 0.004387 |
| Decile 6 | 0.00411641 |
| Median | 0.00387387 |
| Decile 4 | 0.0036407 |
| Decile 3 | 0.00340375 |
| Decile 2 | 0.0031441 |
| Decile 1 | 0.00281034 |
| Minimum | 1.5955e-08 |
|
|
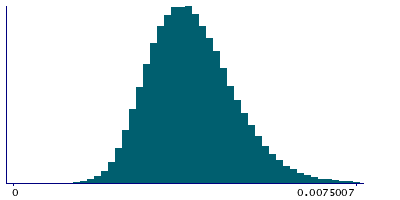
- Mean = 0.00395746
- Std.dev = 0.000956701
- 793 items above graph maximum of 0.00760946
|
2 Instances
Instance 0 : Initial assessment visit (2006-2010) at which participants were recruited and consent given
488,083 participants, 488,083 items
| Maximum | 0.012973 |
| Decile 9 | 0.005206 |
| Decile 8 | 0.00471586 |
| Decile 7 | 0.0043829 |
| Decile 6 | 0.0041125 |
| Median | 0.0038701 |
| Decile 4 | 0.00363704 |
| Decile 3 | 0.0034001 |
| Decile 2 | 0.0031407 |
| Decile 1 | 0.00280729 |
| Minimum | 1.5955e-08 |
|
|
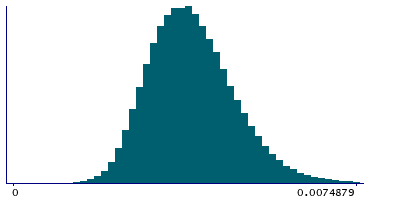
- Mean = 0.0039539
- Std.dev = 0.000956562
- 759 items above graph maximum of 0.00760471
|
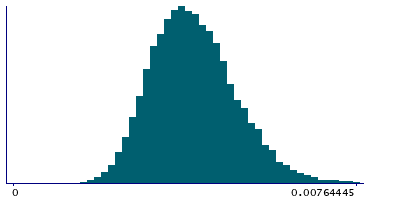
Instance 1 : First repeat assessment visit (2012-13)
19,877 participants, 19,877 items
| Maximum | 0.011288 |
| Decile 9 | 0.00528945 |
| Decile 8 | 0.00480605 |
| Decile 7 | 0.0044803 |
| Decile 6 | 0.0042127 |
| Median | 0.00396625 |
| Decile 4 | 0.0037305 |
| Decile 3 | 0.00349096 |
| Decile 2 | 0.0032259 |
| Decile 1 | 0.0028993 |
| Minimum | 0.001128 |
|
|
- Mean = 0.00404482
- Std.dev = 0.000955946
- 37 items above graph maximum of 0.0076796
|


