Data
507,960 items of data are available, covering 488,512 participants.
Defined-instances run from 0 to 1, labelled using Instancing
2.
Units of measurement are mmol/l.
| Maximum | 0.547785 |
| Decile 9 | 0.22204 |
| Decile 8 | 0.20065 |
| Decile 7 | 0.185935 |
| Decile 6 | 0.173824 |
| Median | 0.162921 |
| Decile 4 | 0.15234 |
| Decile 3 | 0.14142 |
| Decile 2 | 0.12908 |
| Decile 1 | 0.1131 |
| Minimum | 0.0124811 |
|
|
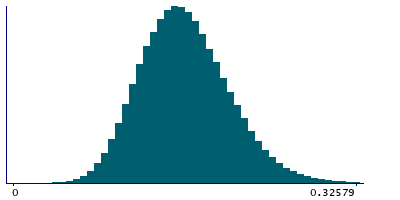
- Mean = 0.165754
- Std.dev = 0.0430484
- 488 items above graph maximum of 0.33098
|
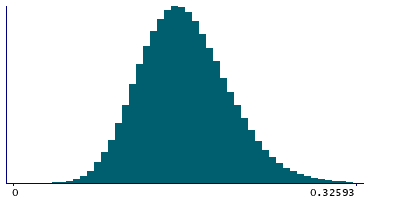
2 Instances
Instance 0 : Initial assessment visit (2006-2010) at which participants were recruited and consent given
488,083 participants, 488,083 items
| Maximum | 0.547785 |
| Decile 9 | 0.222253 |
| Decile 8 | 0.200833 |
| Decile 7 | 0.18612 |
| Decile 6 | 0.17401 |
| Median | 0.1631 |
| Decile 4 | 0.15249 |
| Decile 3 | 0.14157 |
| Decile 2 | 0.12921 |
| Decile 1 | 0.11324 |
| Minimum | 0.0124811 |
|
|
- Mean = 0.165922
- Std.dev = 0.0430745
- 460 items above graph maximum of 0.331267
|
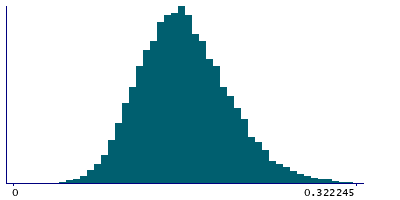
Instance 1 : First repeat assessment visit (2012-13)
19,877 participants, 19,877 items
| Maximum | 0.40143 |
| Decile 9 | 0.21633 |
| Decile 8 | 0.195656 |
| Decile 7 | 0.1811 |
| Decile 6 | 0.16912 |
| Median | 0.158745 |
| Decile 4 | 0.148465 |
| Decile 3 | 0.138096 |
| Decile 2 | 0.125766 |
| Decile 1 | 0.110008 |
| Minimum | 0.033442 |
|
|
- Mean = 0.161639
- Std.dev = 0.0421956
- 27 items above graph maximum of 0.322652
|


