Data
507,960 items of data are available, covering 488,512 participants.
Defined-instances run from 0 to 1, labelled using Instancing
2.
Units of measurement are mmol/l.
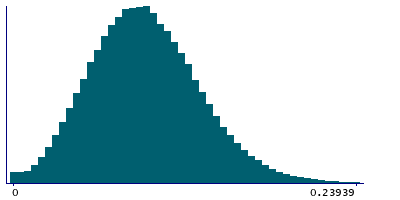
| Maximum | 0.455933 |
| Decile 9 | 0.14302 |
| Decile 8 | 0.12427 |
| Decile 7 | 0.11147 |
| Decile 6 | 0.10073 |
| Median | 0.09107 |
| Decile 4 | 0.081537 |
| Decile 3 | 0.07161 |
| Decile 2 | 0.0603701 |
| Decile 1 | 0.045466 |
| Minimum | 5.8749e-08 |
|

|
- Mean = 0.0931789
- Std.dev = 0.0384855
- 522 items above graph maximum of 0.240574
|
2 Instances
Instance 0 : Initial assessment visit (2006-2010) at which participants were recruited and consent given
488,083 participants, 488,083 items
| Maximum | 0.455933 |
| Decile 9 | 0.143021 |
| Decile 8 | 0.12429 |
| Decile 7 | 0.111495 |
| Decile 6 | 0.10077 |
| Median | 0.091115 |
| Decile 4 | 0.0816088 |
| Decile 3 | 0.071706 |
| Decile 2 | 0.0604896 |
| Decile 1 | 0.0456031 |
| Minimum | 5.8749e-08 |
|
|
- Mean = 0.0932397
- Std.dev = 0.0384523
- 499 items above graph maximum of 0.240438
|
Instance 1 : First repeat assessment visit (2012-13)
19,877 participants, 19,877 items
| Maximum | 0.295197 |
| Decile 9 | 0.14289 |
| Decile 8 | 0.123828 |
| Decile 7 | 0.110755 |
| Decile 6 | 0.099735 |
| Median | 0.0898098 |
| Decile 4 | 0.079661 |
| Decile 3 | 0.0693685 |
| Decile 2 | 0.0574235 |
| Decile 1 | 0.042188 |
| Minimum | 4.3874e-07 |
|

|
- Mean = 0.0916865
- Std.dev = 0.039262
- 21 items above graph maximum of 0.243592
|


