Data
507,303 items of data are available, covering 487,910 participants.
Defined-instances run from 0 to 1, labelled using Instancing
2.
Units of measurement are mmol/l.
| Maximum | 0.942329 |
| Decile 9 | 0.26645 |
| Decile 8 | 0.22089 |
| Decile 7 | 0.19491 |
| Decile 6 | 0.177003 |
| Median | 0.16259 |
| Decile 4 | 0.149823 |
| Decile 3 | 0.13742 |
| Decile 2 | 0.12397 |
| Decile 1 | 0.10625 |
| Minimum | 0 |
|
|
- Mean = 0.175742
- Std.dev = 0.0681483
- 2530 items above graph maximum of 0.42665
|
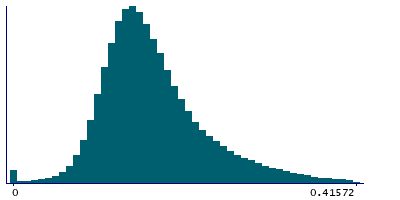
2 Instances
Instance 0 : Initial assessment visit (2006-2010) at which participants were recruited and consent given
487,460 participants, 487,460 items
| Maximum | 0.942329 |
| Decile 9 | 0.26691 |
| Decile 8 | 0.22124 |
| Decile 7 | 0.195208 |
| Decile 6 | 0.177246 |
| Median | 0.162815 |
| Decile 4 | 0.150056 |
| Decile 3 | 0.13764 |
| Decile 2 | 0.12417 |
| Decile 1 | 0.10644 |
| Minimum | 0 |
|

|
- Mean = 0.17601
- Std.dev = 0.0682104
- 2417 items above graph maximum of 0.42738
|
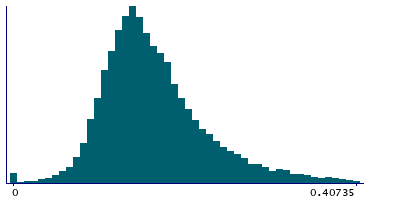
Instance 1 : First repeat assessment visit (2012-13)
19,843 participants, 19,843 items
| Maximum | 0.64529 |
| Decile 9 | 0.25556 |
| Decile 8 | 0.21255 |
| Decile 7 | 0.187689 |
| Decile 6 | 0.171105 |
| Median | 0.156544 |
| Decile 4 | 0.143995 |
| Decile 3 | 0.13225 |
| Decile 2 | 0.119125 |
| Decile 1 | 0.101505 |
| Minimum | 0 |
|
|
- Mean = 0.16916
- Std.dev = 0.066265
- 106 items above graph maximum of 0.409615
|


