Data
507,961 items of data are available, covering 488,513 participants.
Defined-instances run from 0 to 1, labelled using Instancing
2.
Units of measurement are ratio.
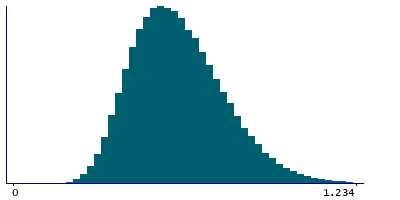
| Maximum | 3.5867 |
| Decile 9 | 0.819187 |
| Decile 8 | 0.73175 |
| Decile 7 | 0.671576 |
| Decile 6 | 0.62196 |
| Median | 0.57823 |
| Decile 4 | 0.53661 |
| Decile 3 | 0.49518 |
| Decile 2 | 0.450627 |
| Decile 1 | 0.395385 |
| Minimum | 0.064523 |
|
|
- Mean = 0.595737
- Std.dev = 0.167507
- 615 items above graph maximum of 1.24299
|
2 Instances
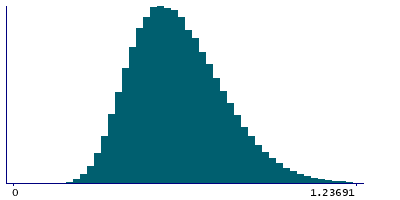
Instance 0 : Initial assessment visit (2006-2010) at which participants were recruited and consent given
488,084 participants, 488,084 items
| Maximum | 3.5867 |
| Decile 9 | 0.820579 |
| Decile 8 | 0.733089 |
| Decile 7 | 0.67269 |
| Decile 6 | 0.622977 |
| Median | 0.57915 |
| Decile 4 | 0.537451 |
| Decile 3 | 0.495833 |
| Decile 2 | 0.451145 |
| Decile 1 | 0.39565 |
| Minimum | 0.064523 |
|
|
- Mean = 0.596615
- Std.dev = 0.16793
- 587 items above graph maximum of 1.24551
|
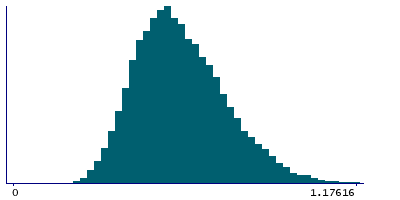
Instance 1 : First repeat assessment visit (2012-13)
19,877 participants, 19,877 items
| Maximum | 1.5741 |
| Decile 9 | 0.78245 |
| Decile 8 | 0.700385 |
| Decile 7 | 0.64435 |
| Decile 6 | 0.597265 |
| Median | 0.556735 |
| Decile 4 | 0.519365 |
| Decile 3 | 0.482135 |
| Decile 2 | 0.440156 |
| Decile 1 | 0.389744 |
| Minimum | 0.13053 |
|
|
- Mean = 0.574179
- Std.dev = 0.15521
- 24 items above graph maximum of 1.17516
|


