Data
507,960 items of data are available, covering 488,512 participants.
Defined-instances run from 0 to 1, labelled using Instancing
2.
Units of measurement are mmol/l.
| Maximum | 1.74922 |
| Decile 9 | 0.6313 |
| Decile 8 | 0.57239 |
| Decile 7 | 0.532208 |
| Decile 6 | 0.498701 |
| Median | 0.467966 |
| Decile 4 | 0.43791 |
| Decile 3 | 0.40631 |
| Decile 2 | 0.37014 |
| Decile 1 | 0.32102 |
| Minimum | 5.02224e-14 |
|
|
- Mean = 0.473186
- Std.dev = 0.123217
- 502 items above graph maximum of 0.94158
|
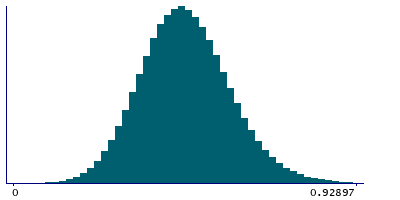
2 Instances
Instance 0 : Initial assessment visit (2006-2010) at which participants were recruited and consent given
488,083 participants, 488,083 items
| Maximum | 1.74922 |
| Decile 9 | 0.63157 |
| Decile 8 | 0.57268 |
| Decile 7 | 0.532471 |
| Decile 6 | 0.499 |
| Median | 0.468281 |
| Decile 4 | 0.43826 |
| Decile 3 | 0.40664 |
| Decile 2 | 0.37061 |
| Decile 1 | 0.321472 |
| Minimum | 5.02224e-14 |
|

|
- Mean = 0.473508
- Std.dev = 0.123145
- 473 items above graph maximum of 0.941668
|
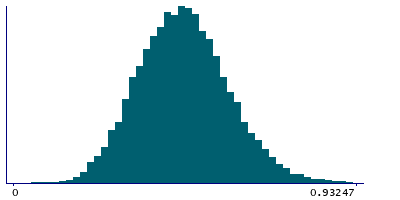
Instance 1 : First repeat assessment visit (2012-13)
19,877 participants, 19,877 items
| Maximum | 1.19172 |
| Decile 9 | 0.624325 |
| Decile 8 | 0.56497 |
| Decile 7 | 0.525195 |
| Decile 6 | 0.491687 |
| Median | 0.460745 |
| Decile 4 | 0.429356 |
| Decile 3 | 0.397115 |
| Decile 2 | 0.359445 |
| Decile 1 | 0.31124 |
| Minimum | 0.0070486 |
|
|
- Mean = 0.465268
- Std.dev = 0.12472
- 29 items above graph maximum of 0.93741
|


