Data
507,960 items of data are available, covering 488,512 participants.
Defined-instances run from 0 to 1, labelled using Instancing
2.
Units of measurement are mmol/l.
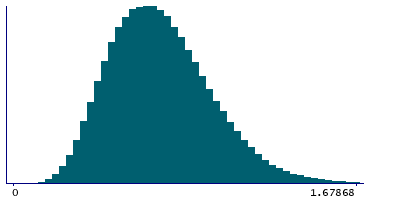
| Maximum | 2.95812 |
| Decile 9 | 1.0631 |
| Decile 8 | 0.93284 |
| Decile 7 | 0.84364 |
| Decile 6 | 0.770521 |
| Median | 0.70553 |
| Decile 4 | 0.64302 |
| Decile 3 | 0.57958 |
| Decile 2 | 0.511014 |
| Decile 1 | 0.42579 |
| Minimum | 0.063553 |
|
|
- Mean = 0.729334
- Std.dev = 0.251288
- 661 items above graph maximum of 1.70041
|
2 Instances
Instance 0 : Initial assessment visit (2006-2010) at which participants were recruited and consent given
488,083 participants, 488,083 items
| Maximum | 2.95812 |
| Decile 9 | 1.06419 |
| Decile 8 | 0.933746 |
| Decile 7 | 0.844504 |
| Decile 6 | 0.7712 |
| Median | 0.706193 |
| Decile 4 | 0.64356 |
| Decile 3 | 0.58004 |
| Decile 2 | 0.511445 |
| Decile 1 | 0.426119 |
| Minimum | 0.063553 |
|

|
- Mean = 0.730009
- Std.dev = 0.25162
- 638 items above graph maximum of 1.70226
|
Instance 1 : First repeat assessment visit (2012-13)
19,877 participants, 19,877 items
| Maximum | 2.27222 |
| Decile 9 | 1.03925 |
| Decile 8 | 0.909194 |
| Decile 7 | 0.82401 |
| Decile 6 | 0.753304 |
| Median | 0.690395 |
| Decile 4 | 0.63005 |
| Decile 3 | 0.567785 |
| Decile 2 | 0.501965 |
| Decile 1 | 0.418849 |
| Minimum | 0.117711 |
|

|
- Mean = 0.712758
- Std.dev = 0.242387
- 18 items above graph maximum of 1.65965
|


