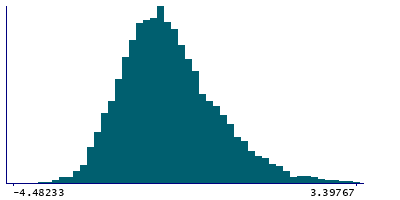
Data
8,338 items of data are available, covering 8,338 participants.
Defined-instances run from 2 to 3, labelled using Instancing
2.
Units of measurement are Std.Devs.
| Maximum | 4.58605 |
| Decile 9 | 0.6 |
| Decile 8 | -0.00351634 |
| Decile 7 | -0.437195 |
| Decile 6 | -0.751857 |
| Median | -1.00869 |
| Decile 4 | -1.27574 |
| Decile 3 | -1.52275 |
| Decile 2 | -1.8 |
| Decile 1 | -2.19794 |
| Minimum | -4.48233 |
|
|
- Mean = -0.886216
- Std.dev = 1.11659
- 20 items above graph maximum of 3.39794
|
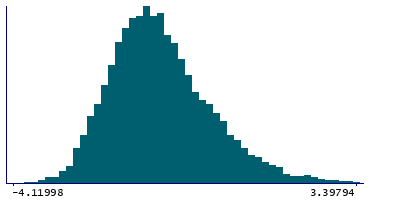
2 Instances
Instance 2 : Imaging visit (2014+)
8,260 participants, 8,260 items
| Maximum | 4.58605 |
| Decile 9 | 0.6 |
| Decile 8 | -0.00104927 |
| Decile 7 | -0.436352 |
| Decile 6 | -0.751267 |
| Median | -1.01094 |
| Decile 4 | -1.27666 |
| Decile 3 | -1.52349 |
| Decile 2 | -1.8 |
| Decile 1 | -2.19821 |
| Minimum | -4.11998 |
|
|
- Mean = -0.885573
- Std.dev = 1.11729
- 20 items above graph maximum of 3.39821
|
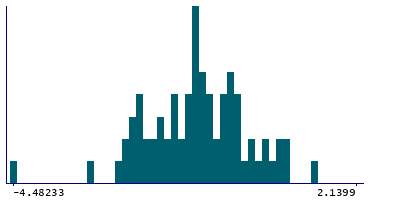
Instance 3 : First repeat imaging visit (2019+)
78 participants, 78 items
| Maximum | 2.1399 |
| Decile 9 | 0.421814 |
| Decile 8 | -0.210334 |
| Decile 7 | -0.41786 |
| Decile 6 | -0.779461 |
| Median | -0.945885 |
| Decile 4 | -1.05961 |
| Decile 3 | -1.37266 |
| Decile 2 | -1.73638 |
| Decile 1 | -2.13657 |
| Minimum | -4.48233 |
|
|
- Mean = -0.954319
- Std.dev = 1.03674
- 1 item above graph maximum of 2.1399
|