Data
7,792 items of data are available, covering 7,792 participants.
Defined-instances run from 2 to 3, labelled using Instancing
2.
Units of measurement are Std.Devs.
| Maximum | 5.40416 |
| Decile 9 | 0.7 |
| Decile 8 | 0.0362007 |
| Decile 7 | -0.350929 |
| Decile 6 | -0.673693 |
| Median | -0.962588 |
| Decile 4 | -1.21031 |
| Decile 3 | -1.49835 |
| Decile 2 | -1.78722 |
| Decile 1 | -2.13544 |
| Minimum | -4.6318 |
|

|
- Mean = -0.830428
- Std.dev = 1.12131
- 12 items above graph maximum of 3.53544
|
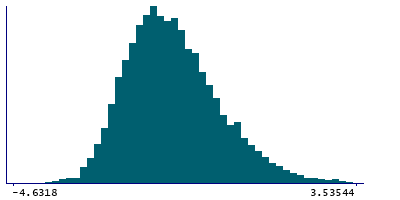
2 Instances
Instance 2 : Imaging visit (2014+)
7,752 participants, 7,752 items
| Maximum | 5.40416 |
| Decile 9 | 0.7 |
| Decile 8 | 0.0409295 |
| Decile 7 | -0.349524 |
| Decile 6 | -0.672176 |
| Median | -0.958361 |
| Decile 4 | -1.21163 |
| Decile 3 | -1.49854 |
| Decile 2 | -1.78722 |
| Decile 1 | -2.13544 |
| Minimum | -4.6318 |
|
|
- Mean = -0.829449
- Std.dev = 1.1221
- 12 items above graph maximum of 3.53544
|
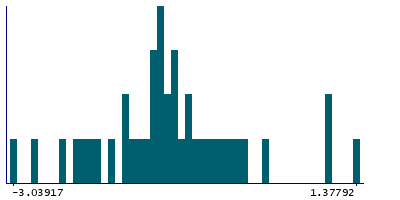
Instance 3 : First repeat imaging visit (2019+)
40 participants, 40 items
| Maximum | 1.37792 |
| Decile 9 | 0.186843 |
| Decile 8 | -0.320613 |
| Decile 7 | -0.699205 |
| Decile 6 | -0.92825 |
| Median | -1.06417 |
| Decile 4 | -1.19038 |
| Decile 3 | -1.34767 |
| Decile 2 | -1.60809 |
| Decile 1 | -2.07995 |
| Minimum | -3.03917 |
|
|
- Mean = -1.02021
- Std.dev = 0.935215
|