Data
640,047 items of data are available, covering 499,328 participants.
Defined-instances run from 0 to 3, labelled using Instancing
2.
Units of measurement are Kg.
| Maximum | 197.7 |
| Decile 9 | 98.2 |
| Decile 8 | 90 |
| Decile 7 | 84.5 |
| Decile 6 | 80.1 |
| Median | 76 |
| Decile 4 | 72.1 |
| Decile 3 | 68.2 |
| Decile 2 | 64 |
| Decile 1 | 58.8 |
| Minimum | 30 |
|
|
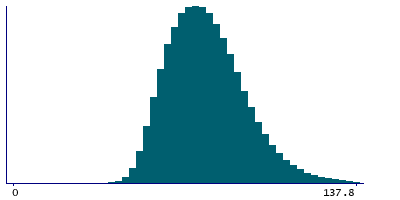
- Mean = 77.6438
- Std.dev = 15.8585
- 1744 items above graph maximum of 137.6
|
4 Instances
Instance 0 : Initial assessment visit (2006-2010) at which participants were recruited and consent given
499,163 participants, 499,163 items
| Maximum | 197.7 |
| Decile 9 | 98.8 |
| Decile 8 | 90.4 |
| Decile 7 | 85 |
| Decile 6 | 80.5 |
| Median | 76.4 |
| Decile 4 | 72.5 |
| Decile 3 | 68.5 |
| Decile 2 | 64.3 |
| Decile 1 | 59.2 |
| Minimum | 30 |
|

|
- Mean = 78.057
- Std.dev = 15.9463
- 1355 items above graph maximum of 138.4
|
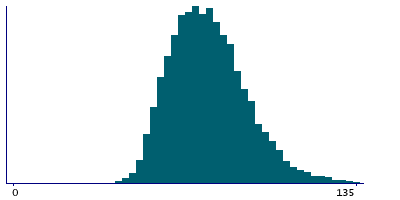
Instance 1 : First repeat assessment visit (2012-13)
20,281 participants, 20,281 items
| Maximum | 182.4 |
| Decile 9 | 96.8 |
| Decile 8 | 88.8 |
| Decile 7 | 83.7 |
| Decile 6 | 79.3 |
| Median | 75.5 |
| Decile 4 | 71.6 |
| Decile 3 | 67.7 |
| Decile 2 | 63.7 |
| Decile 1 | 58.6 |
| Minimum | 35.8 |
|
|
- Mean = 76.9404
- Std.dev = 15.4344
- 66 items above graph maximum of 135
|
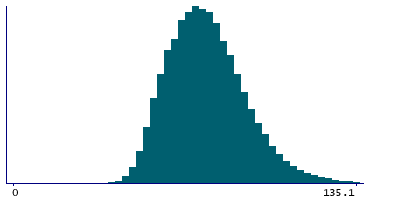
Instance 2 : Imaging visit (2014+)
99,791 participants, 99,791 items
| Maximum | 187 |
| Decile 9 | 96.3 |
| Decile 8 | 88.2 |
| Decile 7 | 82.9 |
| Decile 6 | 78.6 |
| Median | 74.7 |
| Decile 4 | 70.9 |
| Decile 3 | 67 |
| Decile 2 | 62.7 |
| Decile 1 | 57.5 |
| Minimum | 33 |
|
|
- Mean = 76.1406
- Std.dev = 15.529
- 265 items above graph maximum of 135.1
|
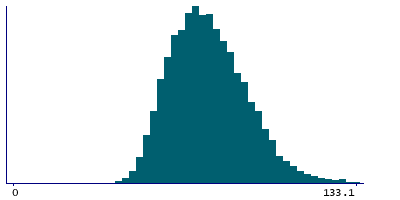
Instance 3 : First repeat imaging visit (2019+)
20,812 participants, 20,812 items
| Maximum | 171.4 |
| Decile 9 | 95.3 |
| Decile 8 | 87.6 |
| Decile 7 | 82.4 |
| Decile 6 | 78.1 |
| Median | 74.3 |
| Decile 4 | 70.6 |
| Decile 3 | 66.8 |
| Decile 2 | 62.5 |
| Decile 1 | 57.4 |
| Minimum | 34 |
|
|
- Mean = 75.6271
- Std.dev = 15.0866
- 47 items above graph maximum of 133.2
|
