Data
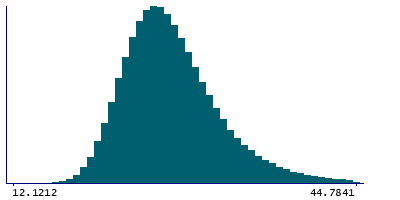
639,668 items of data are available, covering 499,024 participants.
Defined-instances run from 0 to 3, labelled using Instancing
2.
Units of measurement are Kg/m2.
| Maximum | 74.6837 |
| Decile 9 | 33.3483 |
| Decile 8 | 30.6315 |
| Decile 7 | 28.9647 |
| Decile 6 | 27.6817 |
| Median | 26.5808 |
| Decile 4 | 25.5648 |
| Decile 3 | 24.5389 |
| Decile 2 | 23.4168 |
| Decile 1 | 21.9669 |
| Minimum | 12.1212 |
|
|
- Mean = 27.2635
- Std.dev = 4.76116
- 3321 items above graph maximum of 44.7297
|
4 Instances
Instance 0 : Initial assessment visit (2006-2010) at which participants were recruited and consent given
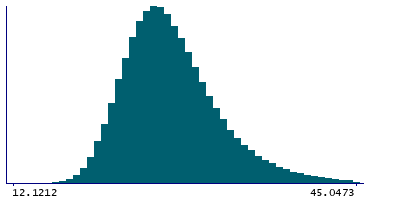
498,833 participants, 498,833 items
| Maximum | 74.6837 |
| Decile 9 | 33.5721 |
| Decile 8 | 30.8244 |
| Decile 7 | 29.1406 |
| Decile 6 | 27.8531 |
| Median | 26.7455 |
| Decile 4 | 25.7188 |
| Decile 3 | 24.684 |
| Decile 2 | 23.552 |
| Decile 1 | 22.0967 |
| Minimum | 12.1212 |
|
|
- Mean = 27.4335
- Std.dev = 4.8032
- 2603 items above graph maximum of 45.0475
|
Instance 1 : First repeat assessment visit (2012-13)
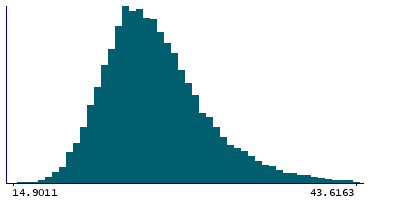
20,277 participants, 20,277 items
| Maximum | 59.375 |
| Decile 9 | 32.7707 |
| Decile 8 | 30.1008 |
| Decile 7 | 28.5359 |
| Decile 6 | 27.3121 |
| Median | 26.2857 |
| Decile 4 | 25.3079 |
| Decile 3 | 24.3359 |
| Decile 2 | 23.3237 |
| Decile 1 | 21.9203 |
| Minimum | 14.9011 |
|
|
- Mean = 26.9561
- Std.dev = 4.58791
- 132 items above graph maximum of 43.6211
|
Instance 2 : Imaging visit (2014+)
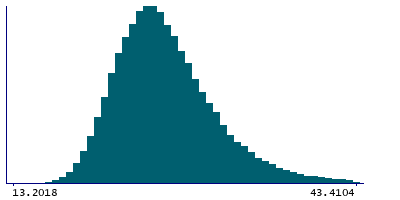
99,746 participants, 99,746 items
| Maximum | 69.63 |
| Decile 9 | 32.4839 |
| Decile 8 | 29.8924 |
| Decile 7 | 28.2876 |
| Decile 6 | 27.0591 |
| Median | 25.9879 |
| Decile 4 | 25.0036 |
| Decile 3 | 24.022 |
| Decile 2 | 22.903 |
| Decile 1 | 21.507 |
| Minimum | 13.2018 |
|
|
- Mean = 26.6257
- Std.dev = 4.57342
- 488 items above graph maximum of 43.4607
|
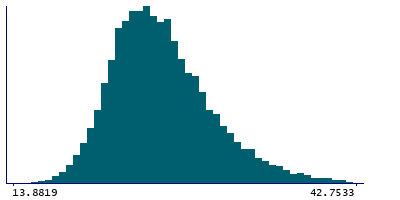
Instance 3 : First repeat imaging visit (2019+)
20,812 participants, 20,812 items
| Maximum | 56.6125 |
| Decile 9 | 32.2616 |
| Decile 8 | 29.7601 |
| Decile 7 | 28.2031 |
| Decile 6 | 26.9788 |
| Median | 25.963 |
| Decile 4 | 24.9807 |
| Decile 3 | 23.9858 |
| Decile 2 | 22.923 |
| Decile 1 | 21.5763 |
| Minimum | 13.8819 |
|
|
- Mean = 26.5462
- Std.dev = 4.44532
- 93 items above graph maximum of 42.9468
|


